How it works
Map it. Measure it. Prove it changed.
Three tools that work together to turn community relationships into the hard numbers your funders, regulators, and board need to see.
From first baseline to final report, every step produces evidence.
The workflow
Four steps. One clear picture of change.
Map
Build a picture of who knows who
Measure
Score six dimensions of community strength
Evidence
Attach observations to every assessment
Report
Generate reports that answer the "so what?"
See who knows who.
Then watch it change.
The Nectogram is a living map of your community's real relationships. Not org charts or mailing lists. The actual connections between people, categorised by type.
Take a snapshot at the start of your programme. Take another at the end. The comparison is visual, quantifiable, and broken down by connection type.
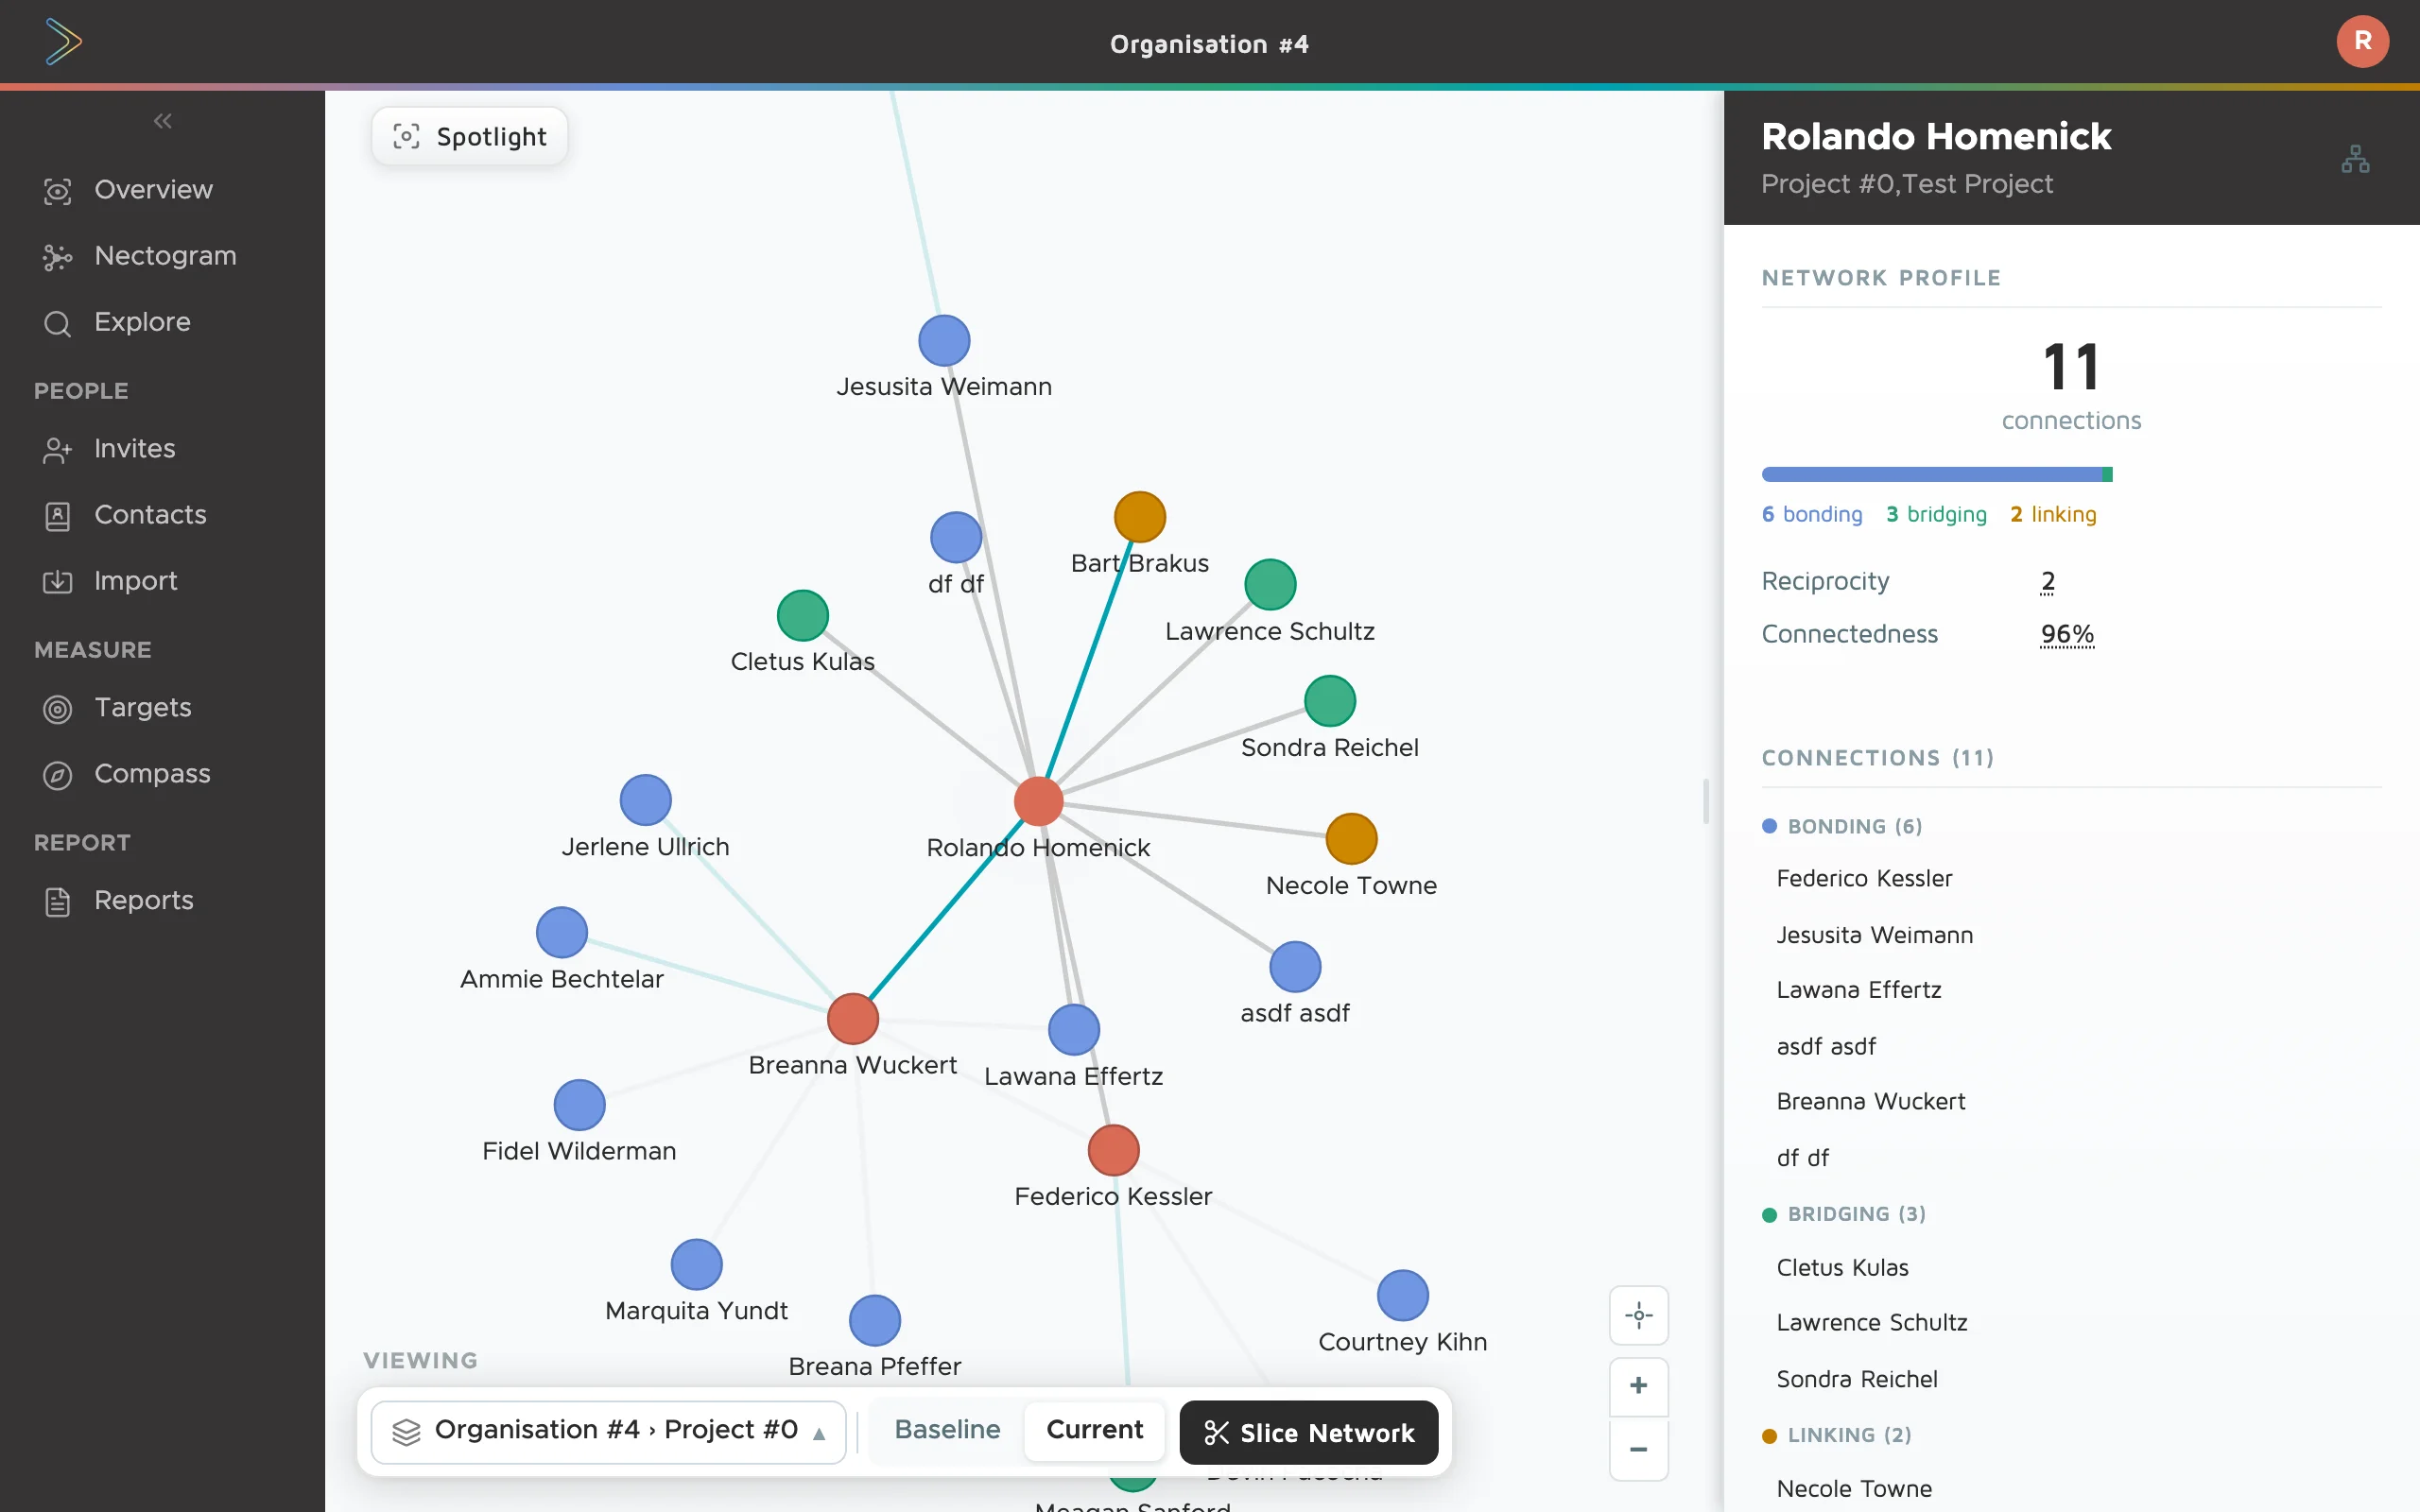
Capture the starting state of your network. How many connections exist? What types? Where are the gaps? This becomes the reference point everything is measured against.
Run the same mapping again after your intervention. The platform calculates the difference automatically: new connections, changed types, growth percentages, broken down by category.
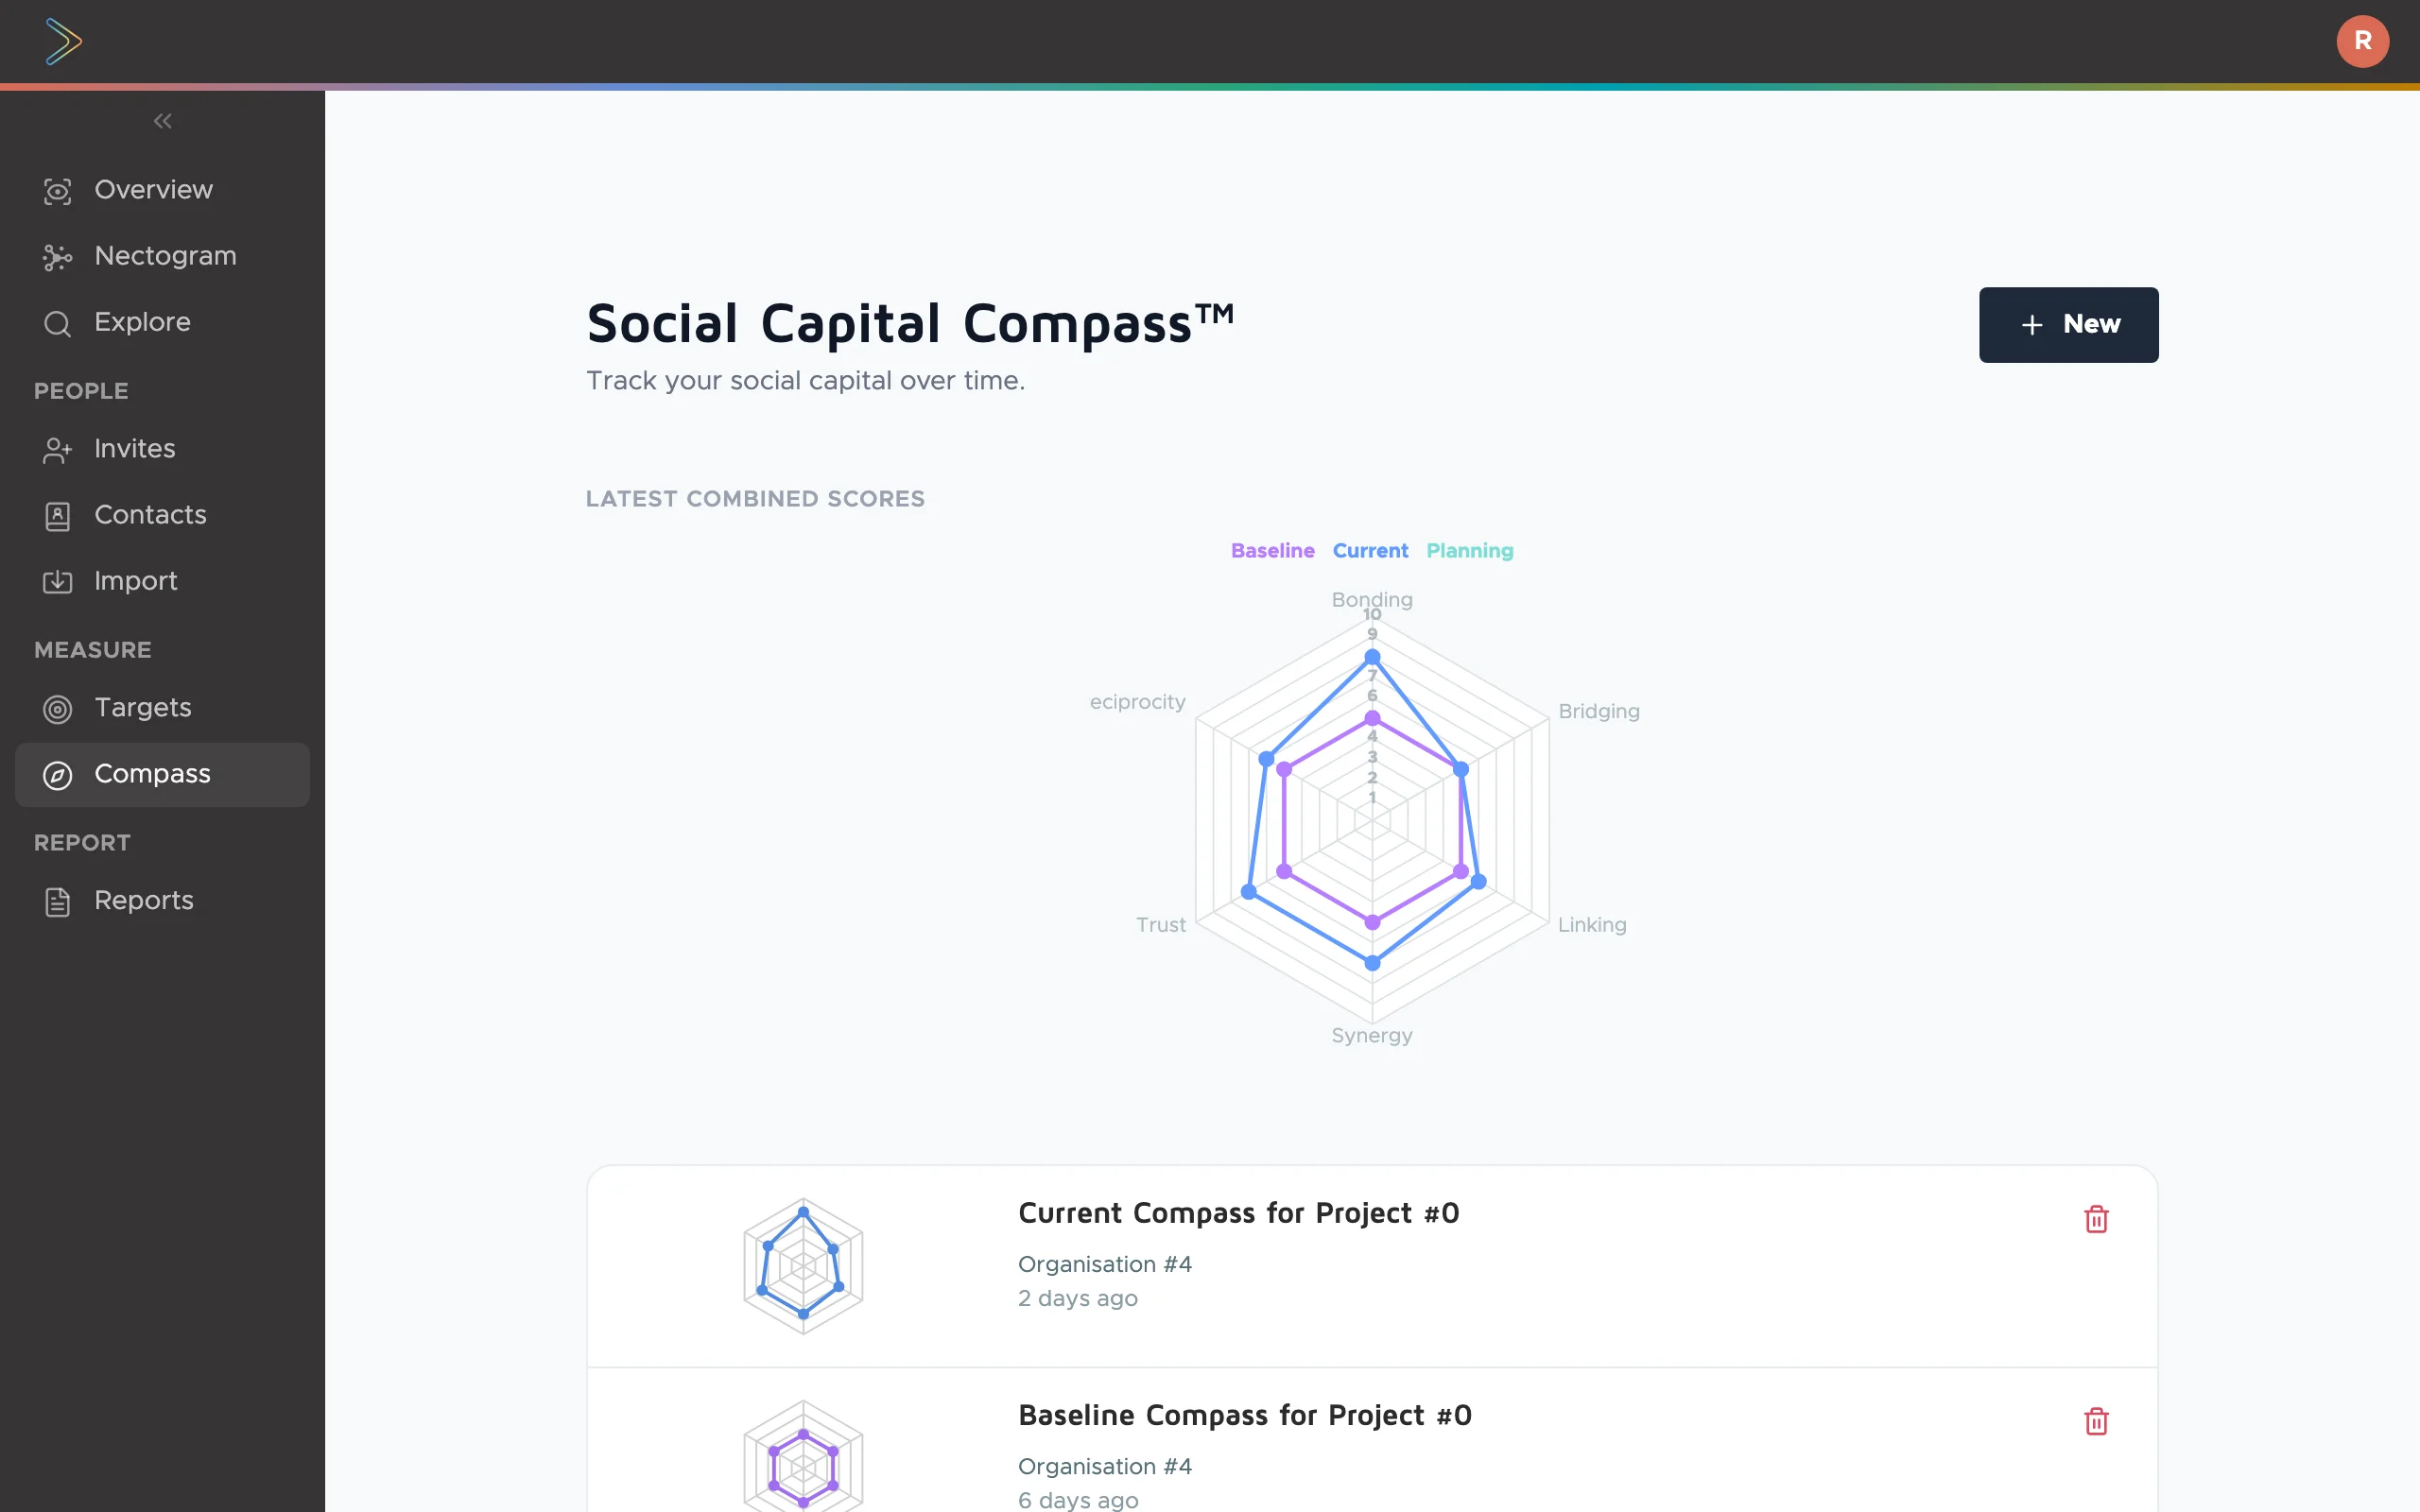
Six dimensions.
Three points in time.
The Social Capital Compass scores your community across six research-backed dimensions. Each one is assessed at baseline, at the current point, and against a planned target.
Every score has evidence attached. Not just a number, but the observations, quotes, and context that explain why it changed.
Bonding
Close ties within groups. The relationships people rely on day to day.
Bridging
Connections between different groups. How information and opportunity travel.
Linking
Relationships with people who hold institutional power or resources.
Synergy
Common language, values, and goals across a network.
Trust
The degree to which people feel safe relying on each other.
Reciprocity
Whether support flows in both directions, not just one.
Where you started. The honest assessment before any intervention.
Where you are now. Updated as your programme progresses.
Where you want to be. The target that shapes your delivery.
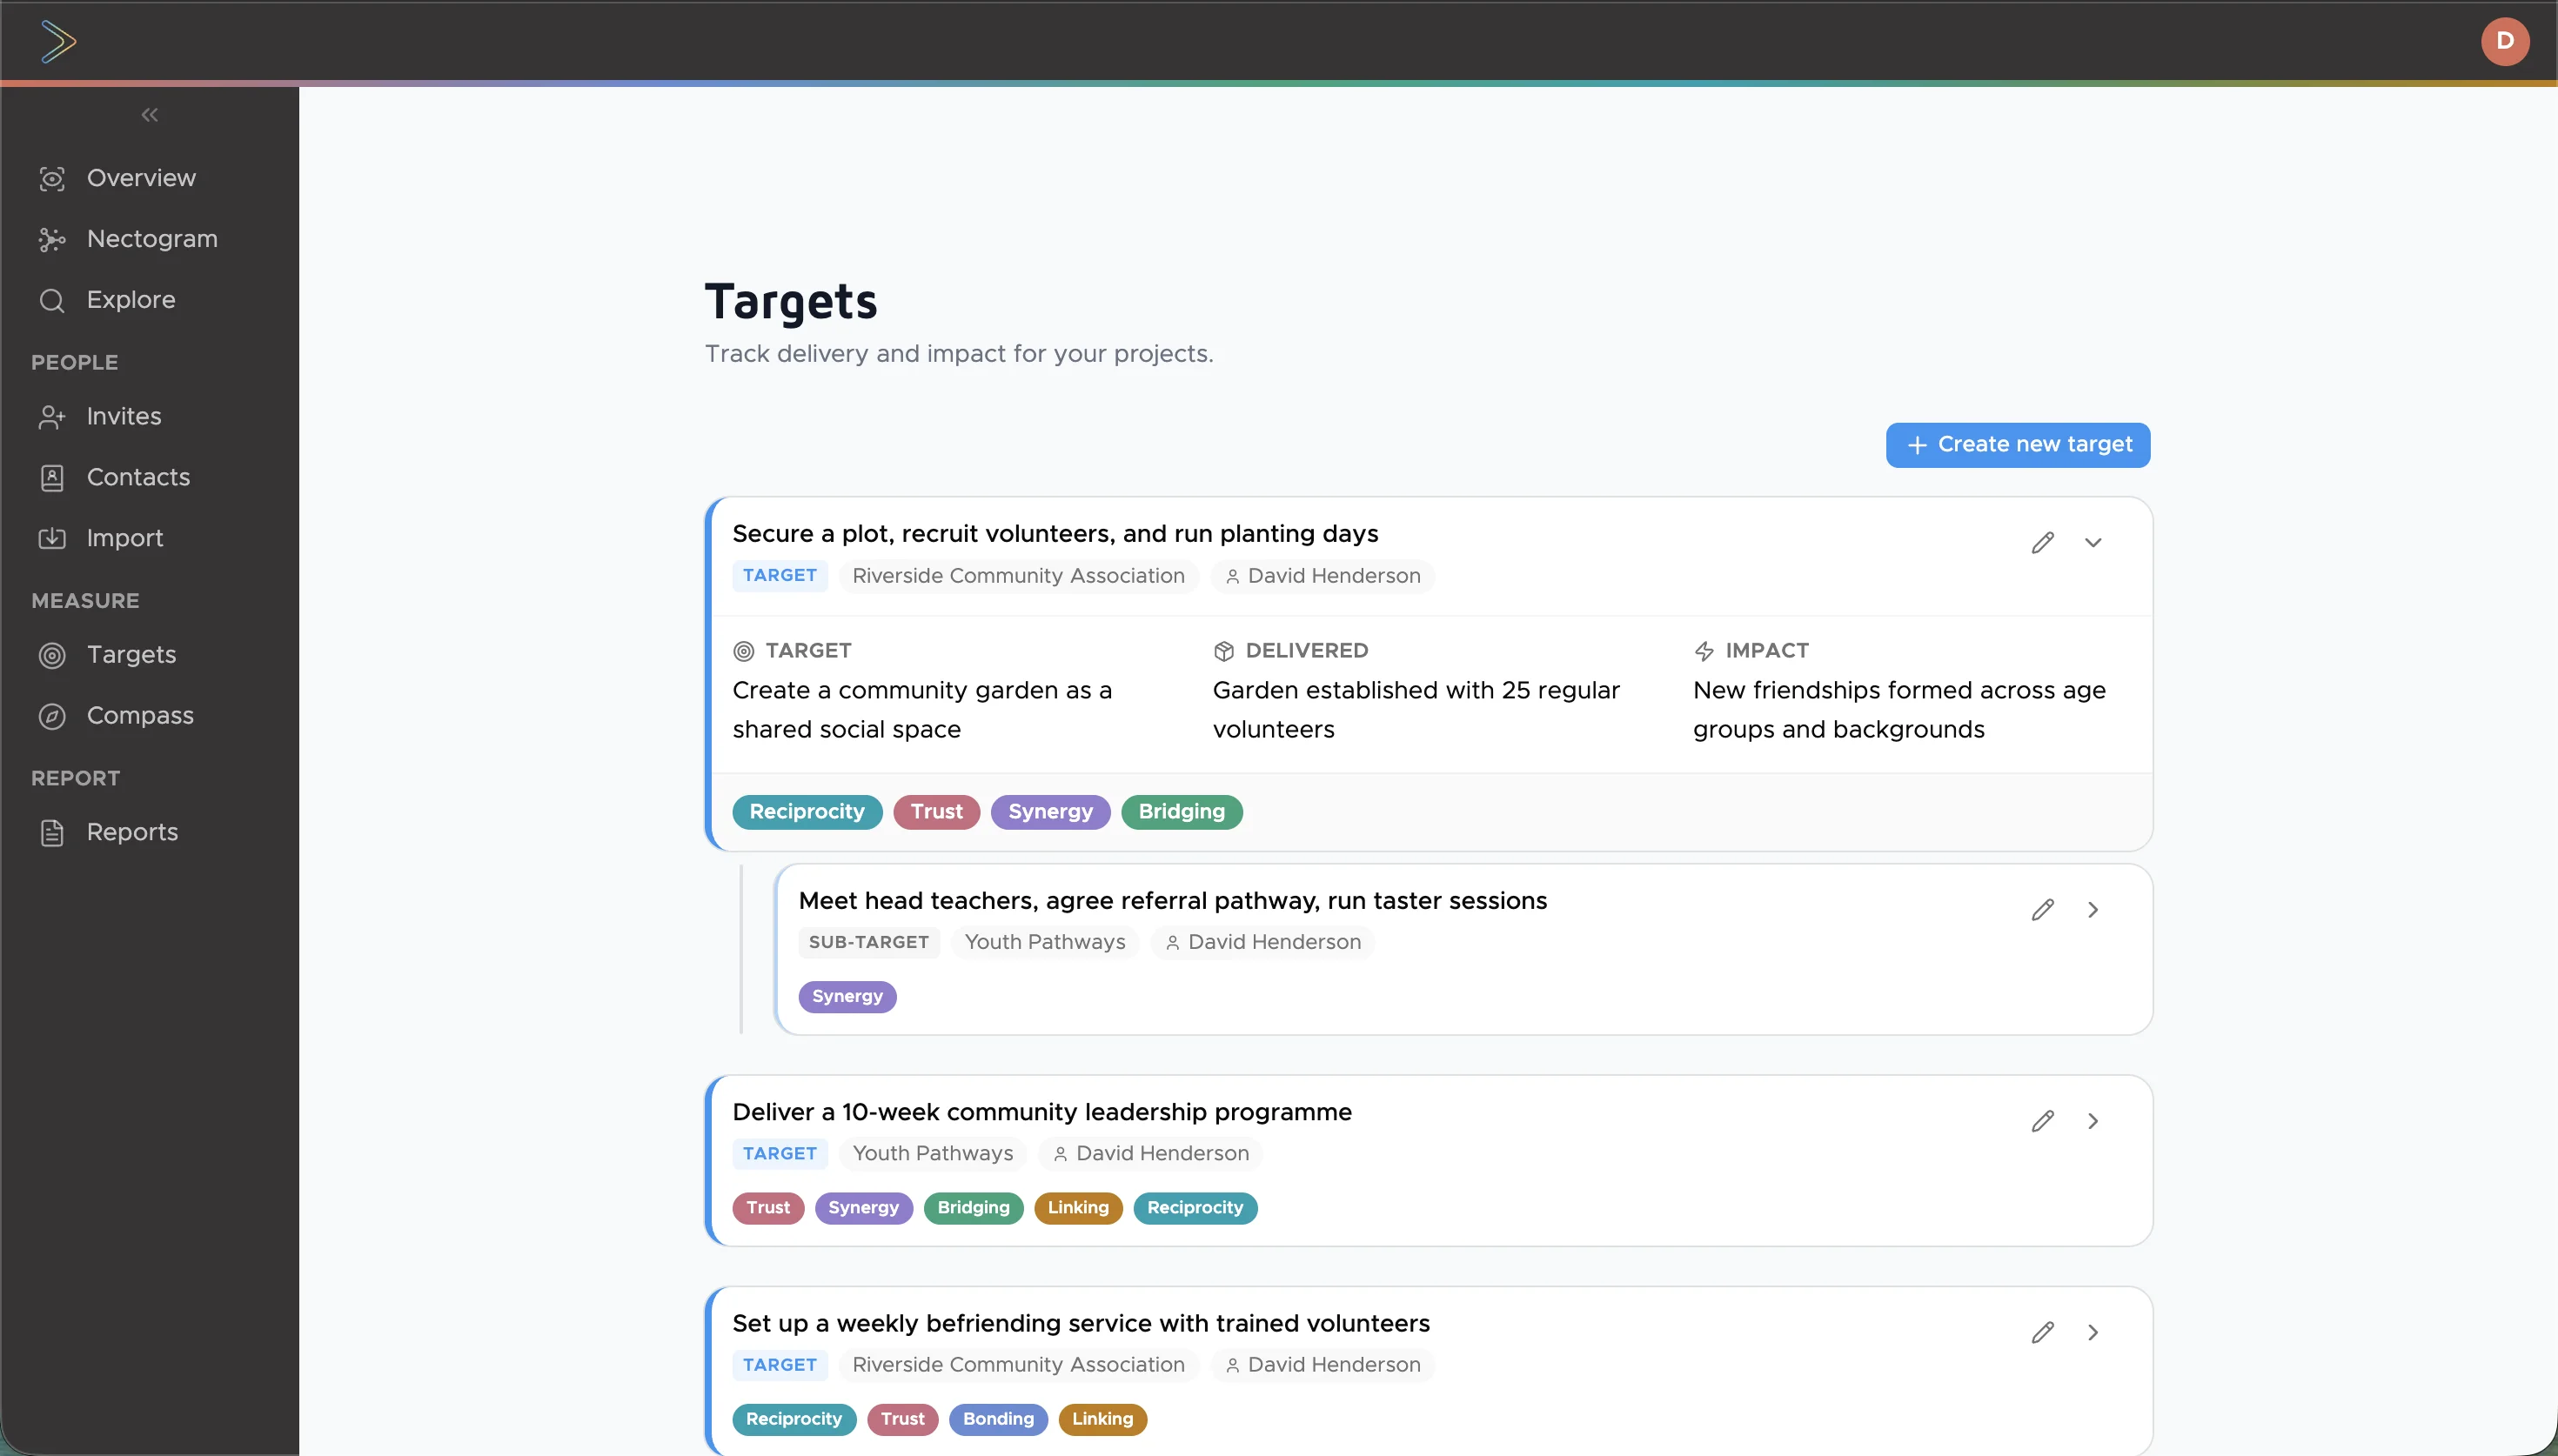
Set targets. Track delivery.
Generate the report.
Define what success looks like with measurable targets linked to real outcomes. As your programme runs, the platform tracks delivery against those targets and collects observations from staff across the organisation.
When it's time to report, everything is already there. Pull a report at individual, project, or programme level and it draws together the network data, compass scores, targets, and evidence into a single document.
Individual reports
Each person's network growth, compass scores, and evidence over time. Useful for one-to-one reviews and personal development.
Project reports
Aggregate data across a project team. Before and after comparison, targets hit, evidence collected. Ready for your funder update.
Programme reports
Organisation-wide view spanning multiple projects. The full picture for annual returns, board papers, and regulatory submissions.
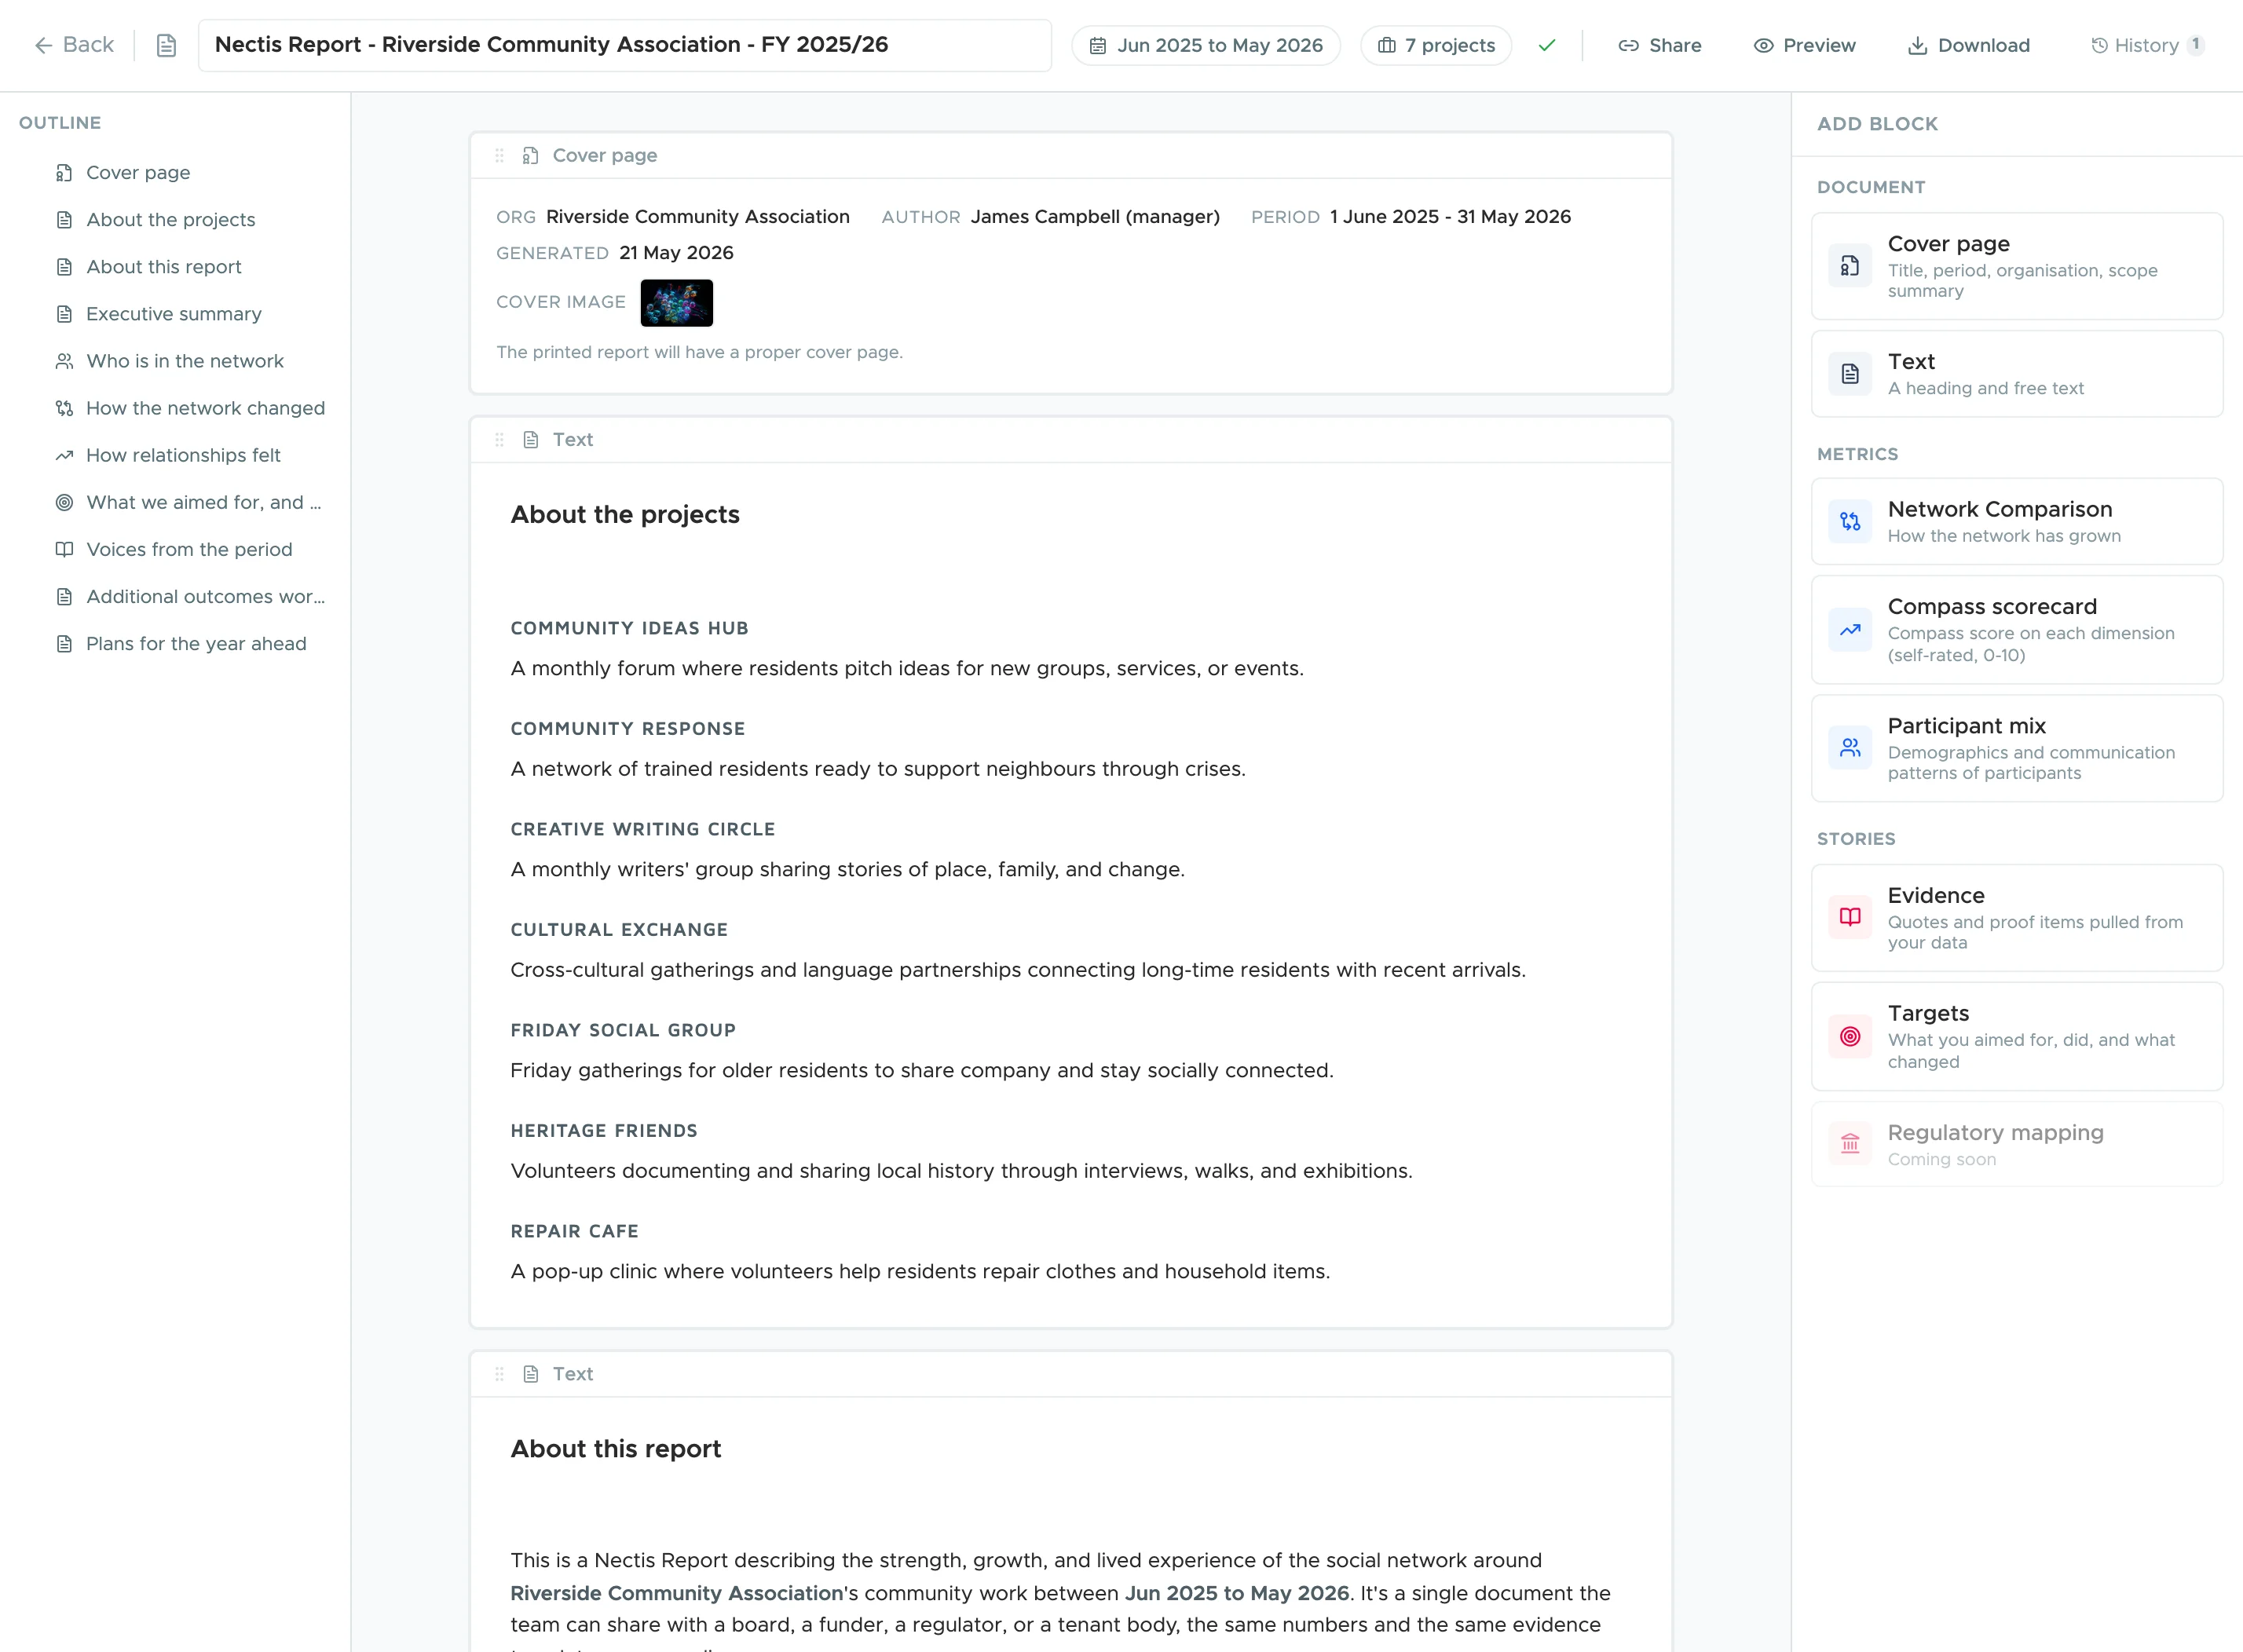
A report that writes itself.
Then lets you edit every word.
Pick the blocks you need: cover page, executive summary, network comparison, compass scorecard, participant mix, evidence, targets, regulatory mapping. The platform fills each one in with prose drawn from your actual data.
Every block is editable. Rearrange the outline, rewrite the language, add your own context. The data stays in sync; your voice stays in the document.
The dashboard
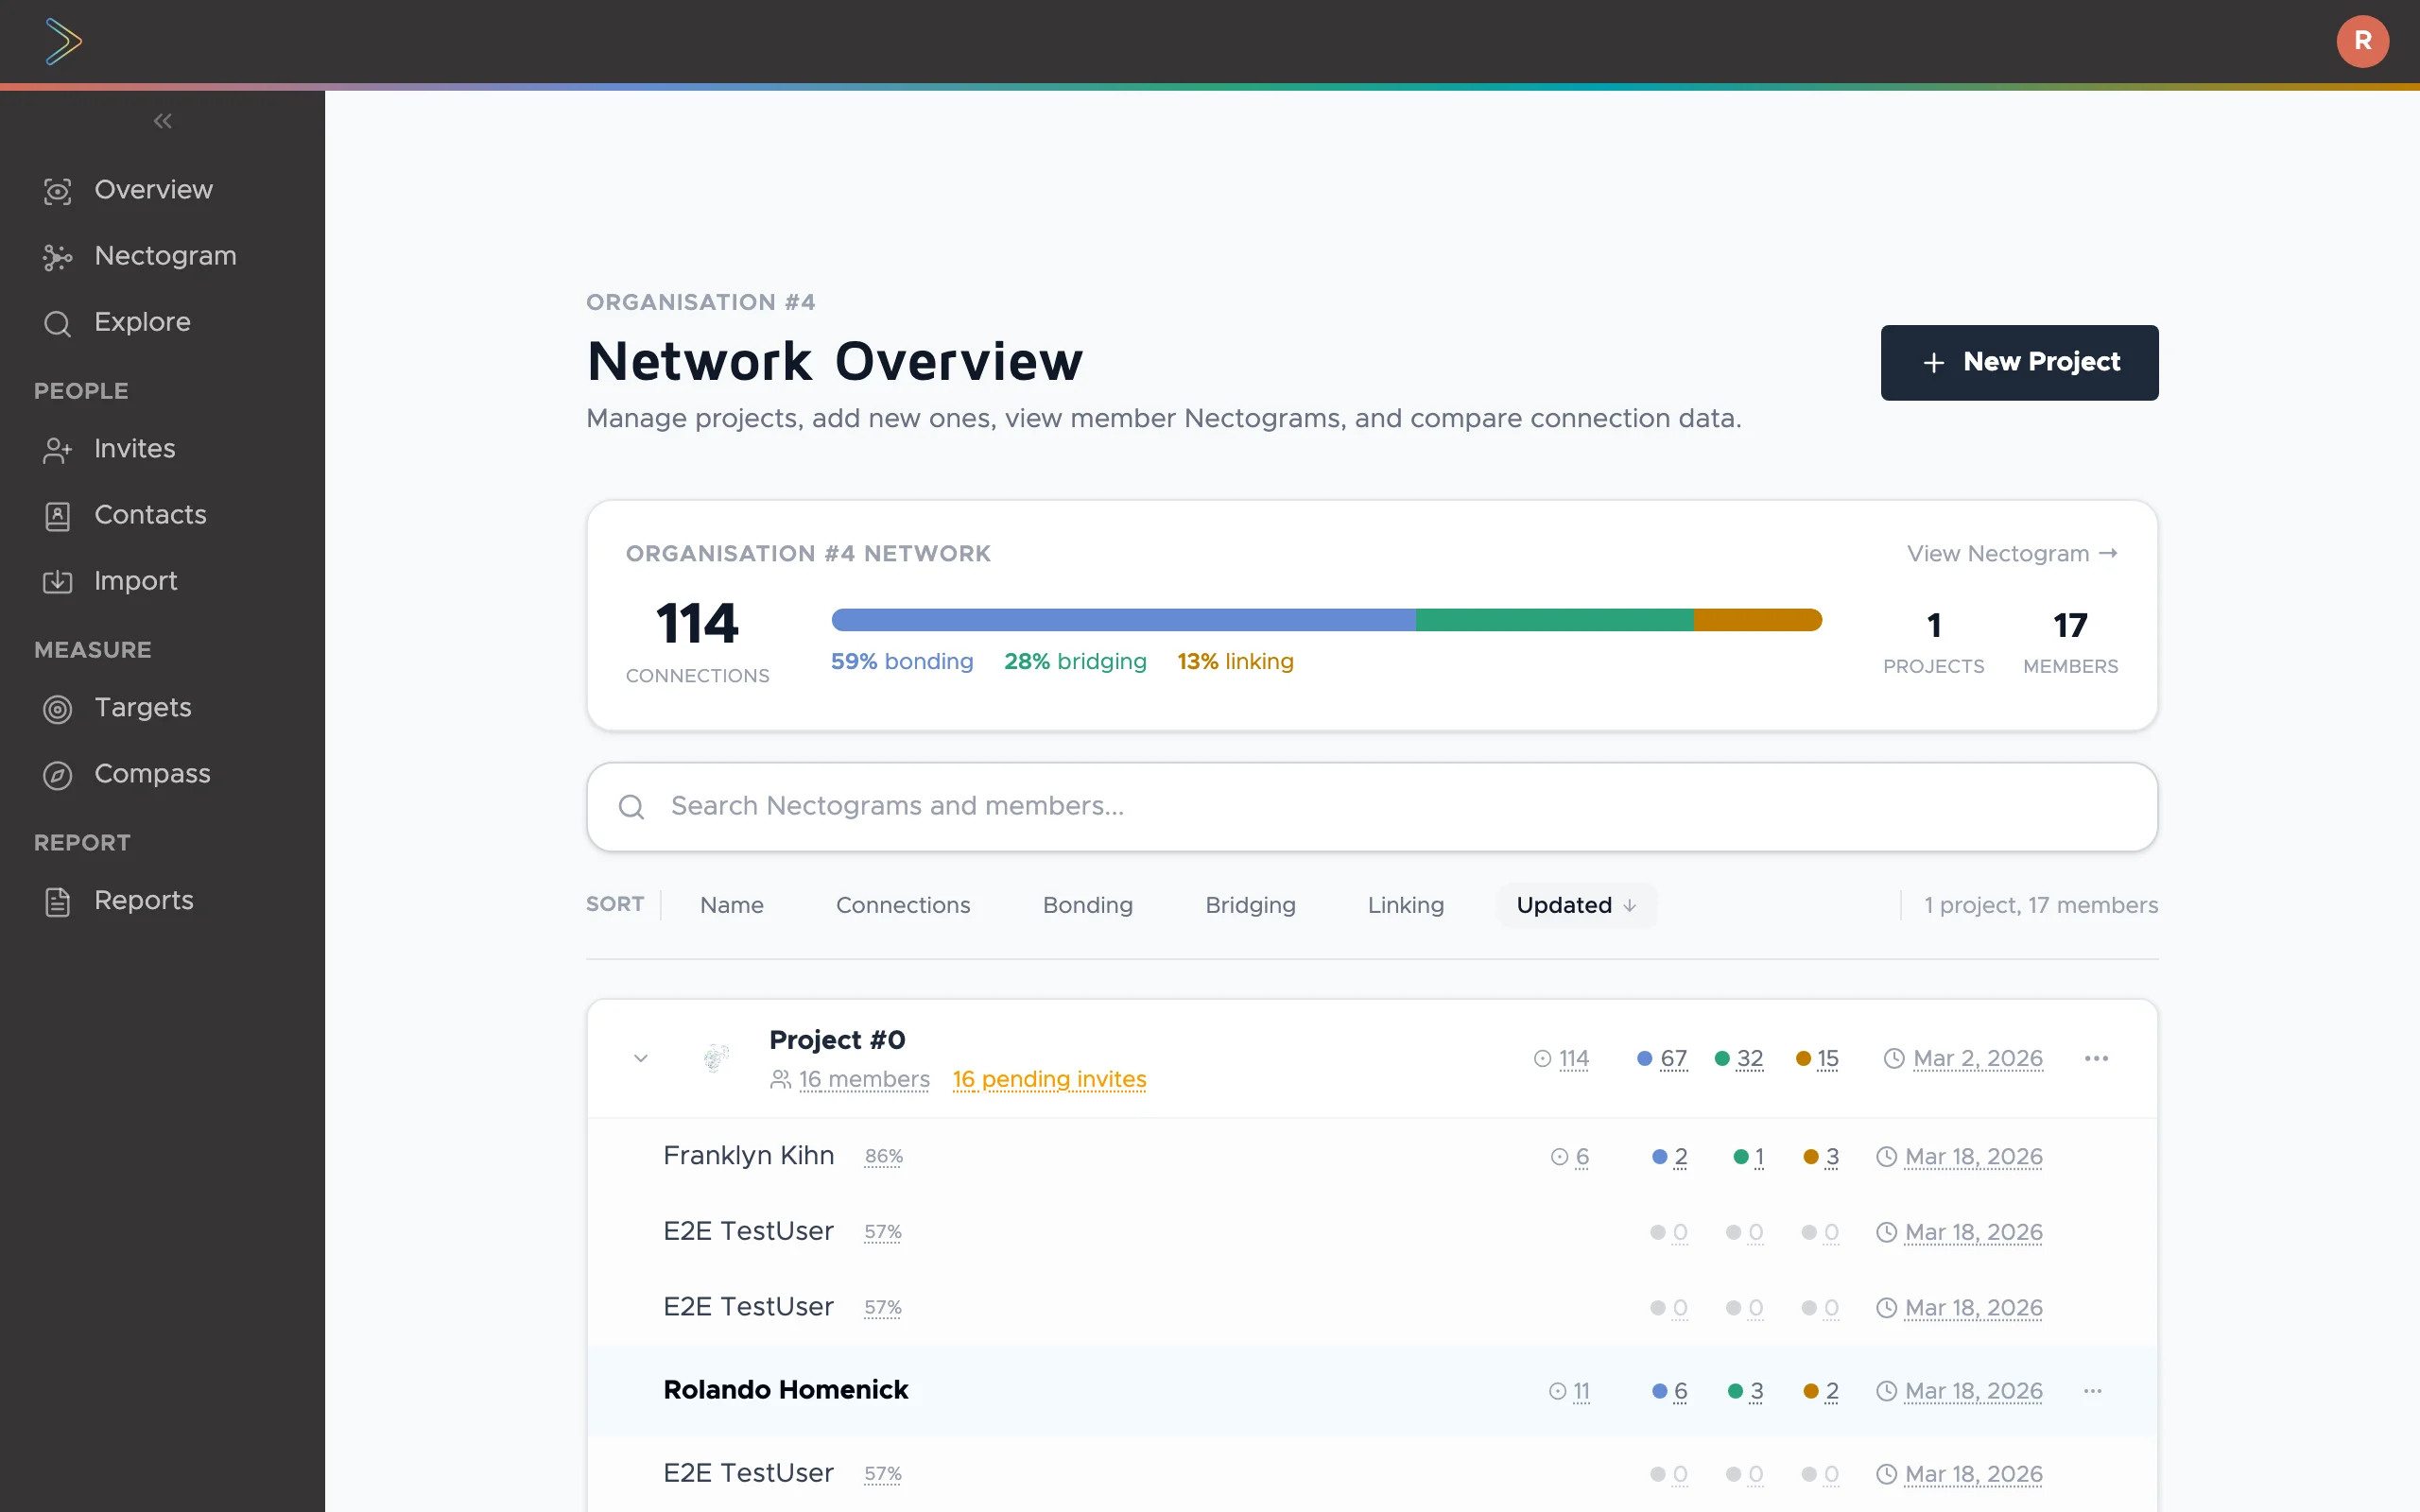
One dashboard.
Everything you need.
Individual users see their own network and how to grow it. Managers see their projects and teams. Portfolio users see the whole programme with aggregate data across every organisation.
Each role sees exactly what matters to them, nothing more, nothing less. No training manuals, no complex permissions. Just the right view for the right person.
Stop guessing
See team dynamics with real data, not assumptions.
Individual ownership
People take charge of growing their own professional network.
Leadership view
A single view of collaboration health across the organisation.
Demographic breakdowns
Reveal hidden patterns by age, gender, location, and more.
Integrations
Connect your tools. The data comes to you.
Import connections from the platforms your community already uses. Connect Slack and Microsoft Outlook to automatically map real communication patterns. Or upload a CSV. Or add connections manually. Every source merges into one unified view.
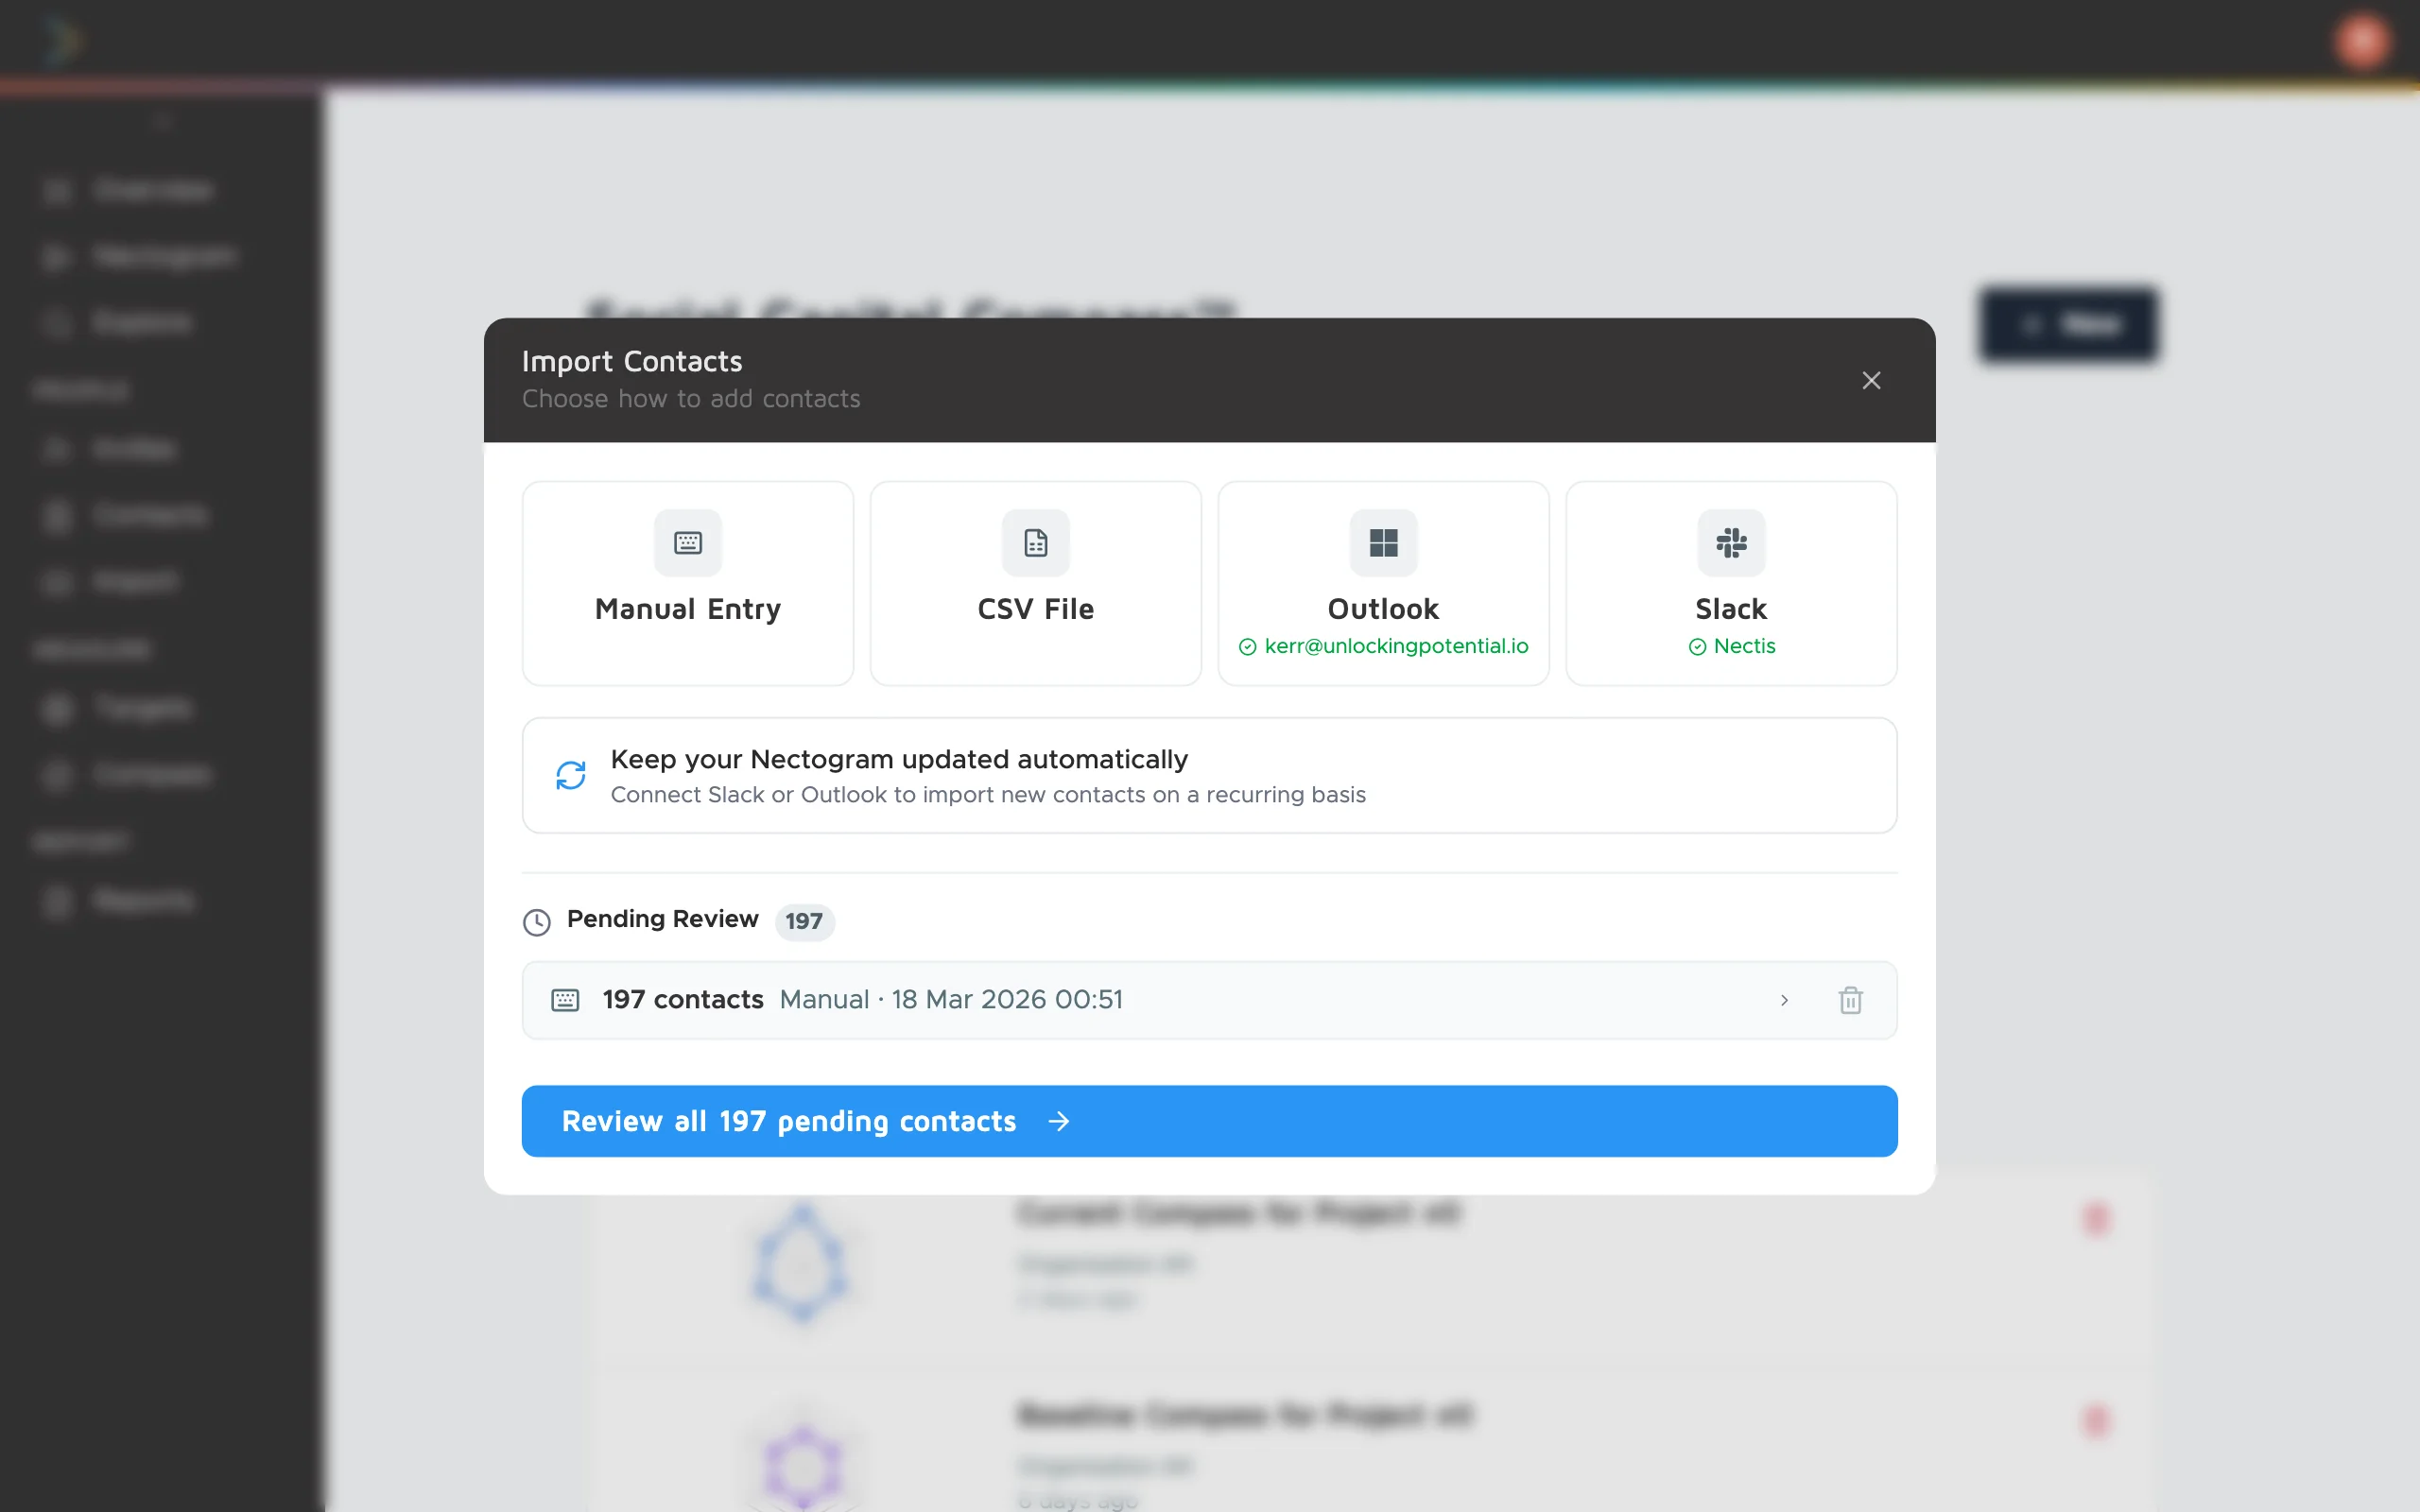
Slack
Connect a workspace and import communication patterns automatically.
Microsoft Outlook
Pull in contacts and interaction data via Microsoft Graph.
CSV upload
Bulk import from a spreadsheet with automatic duplicate detection.
Manual entry
Add connections one by one with full categorisation.
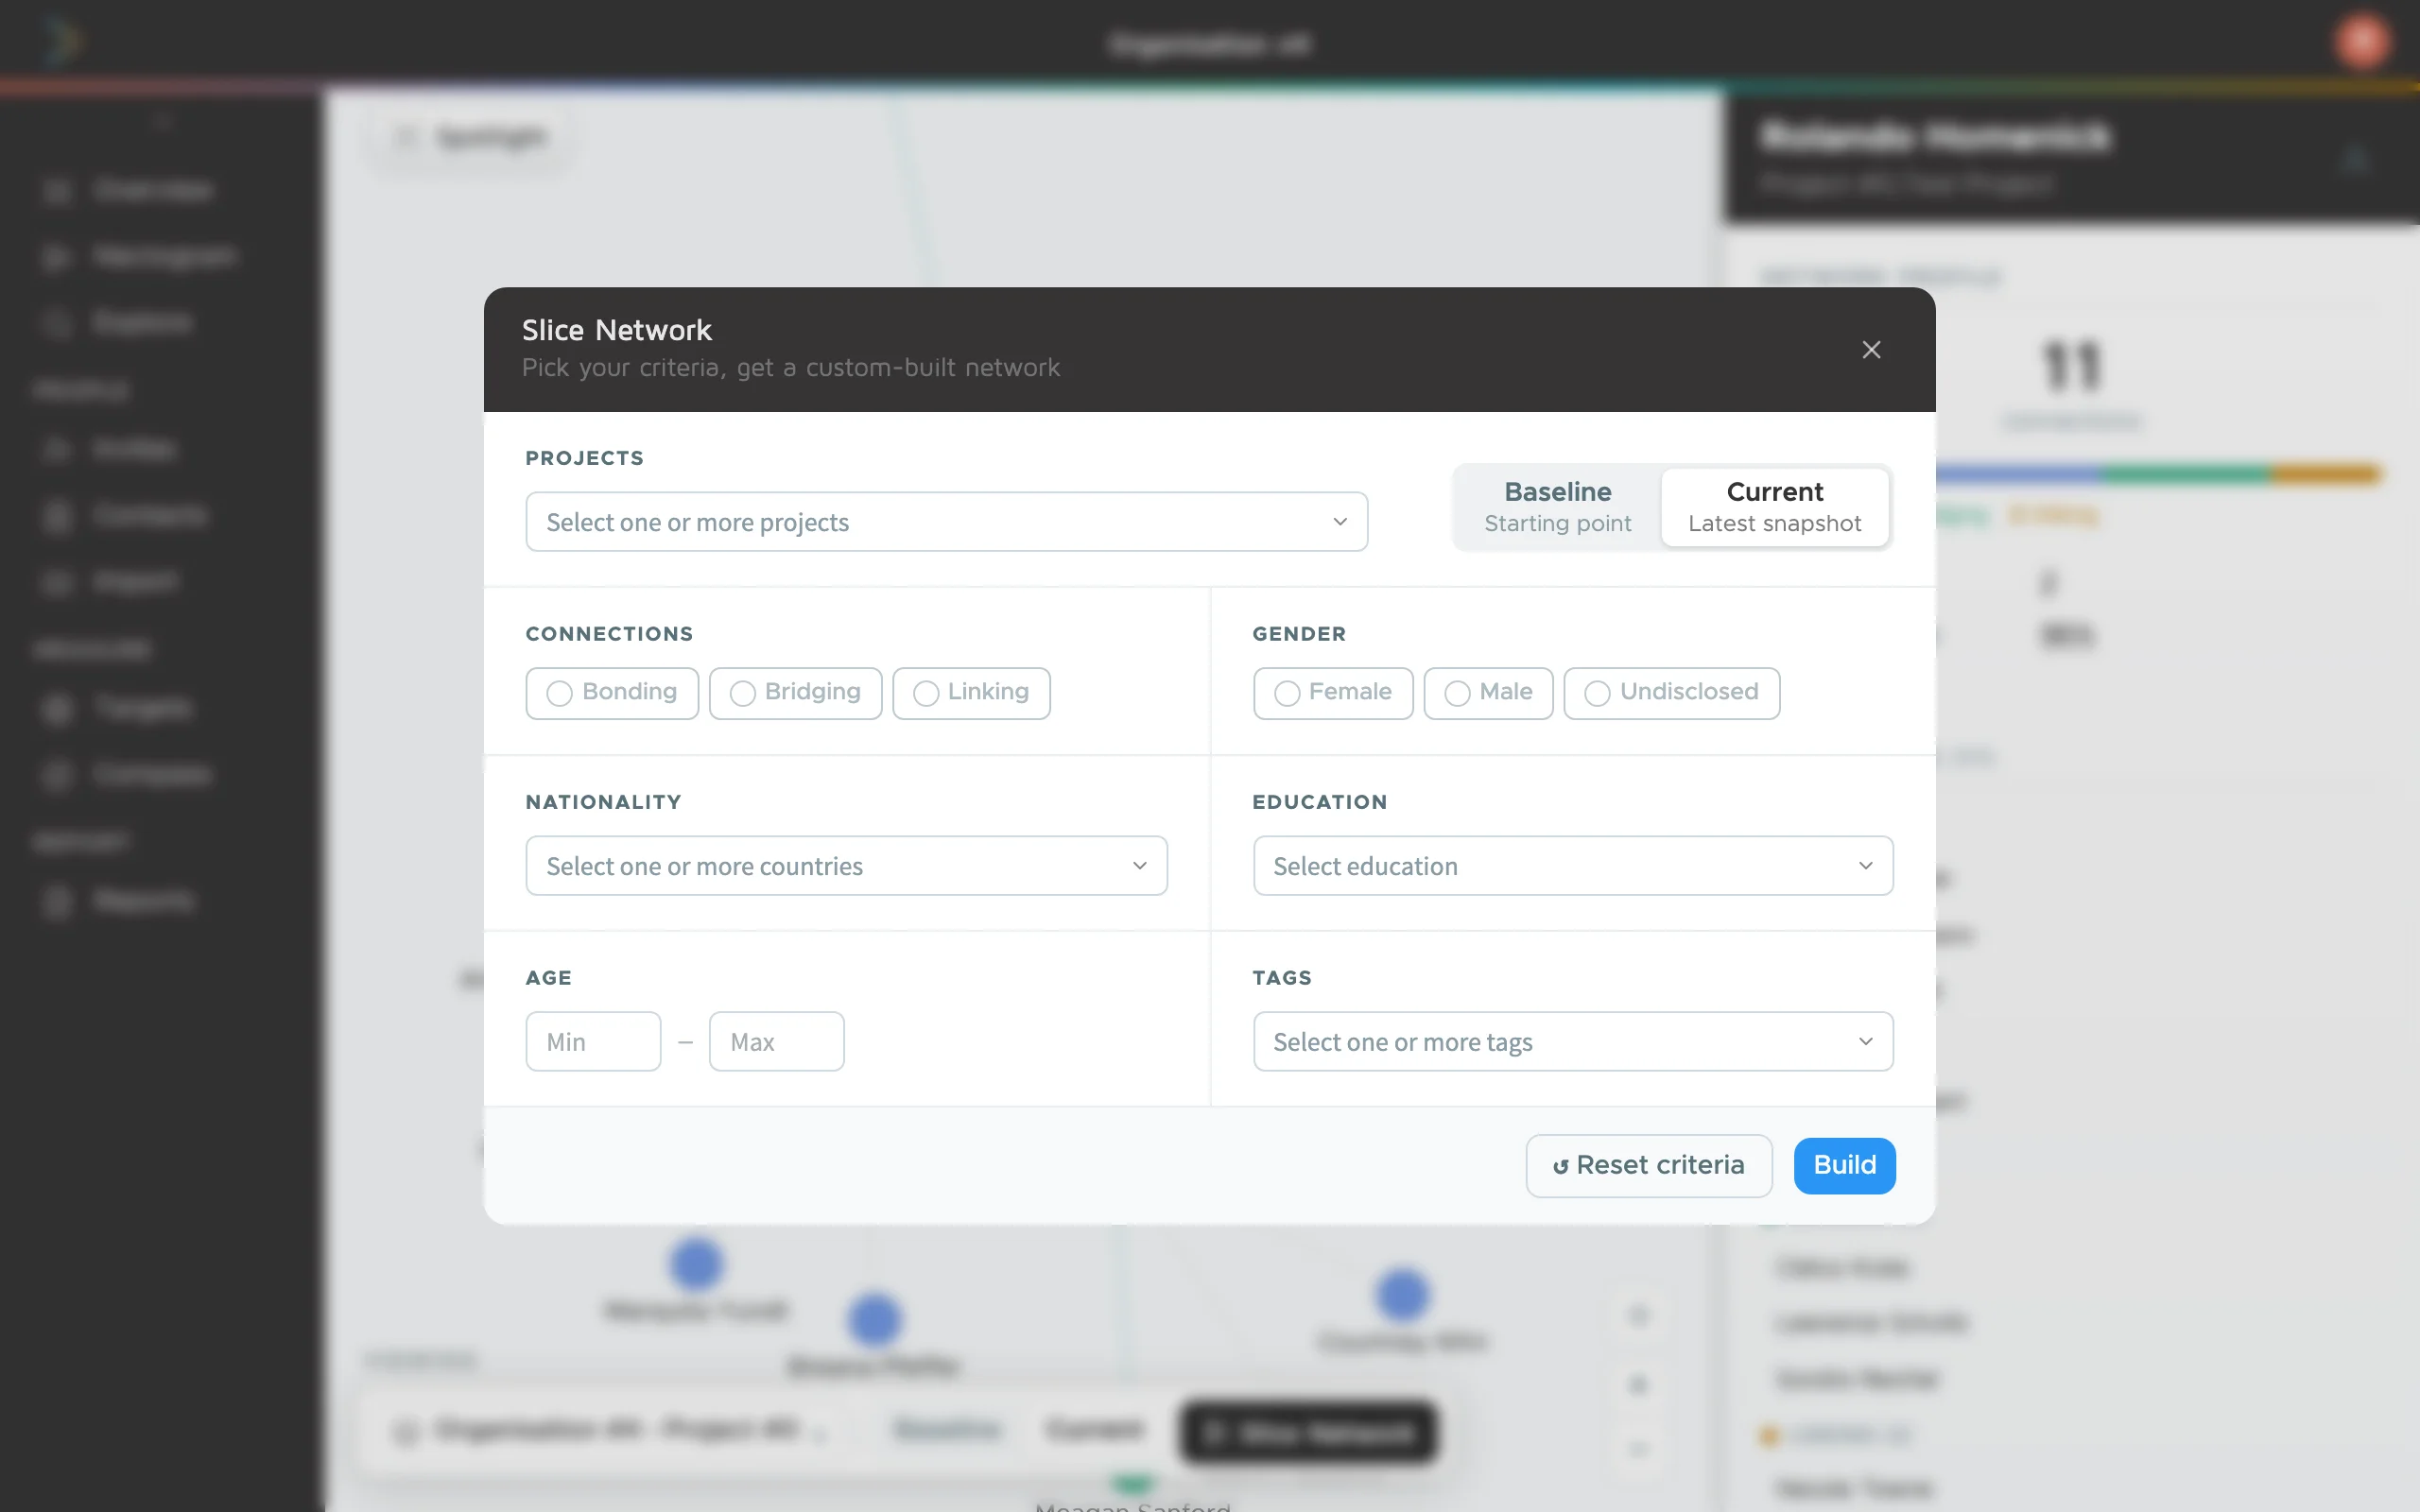
Filtering
Slice the data any way you need.
Filter your Nectogram by connection type, project, demographic group, or time period. Isolate bonding connections to see close-knit clusters. Show only bridging links to find where groups are reaching across boundaries.
When a funder asks "did linking connections increase for female participants aged 16 to 24?" you can answer in seconds, not weeks.
Exploration
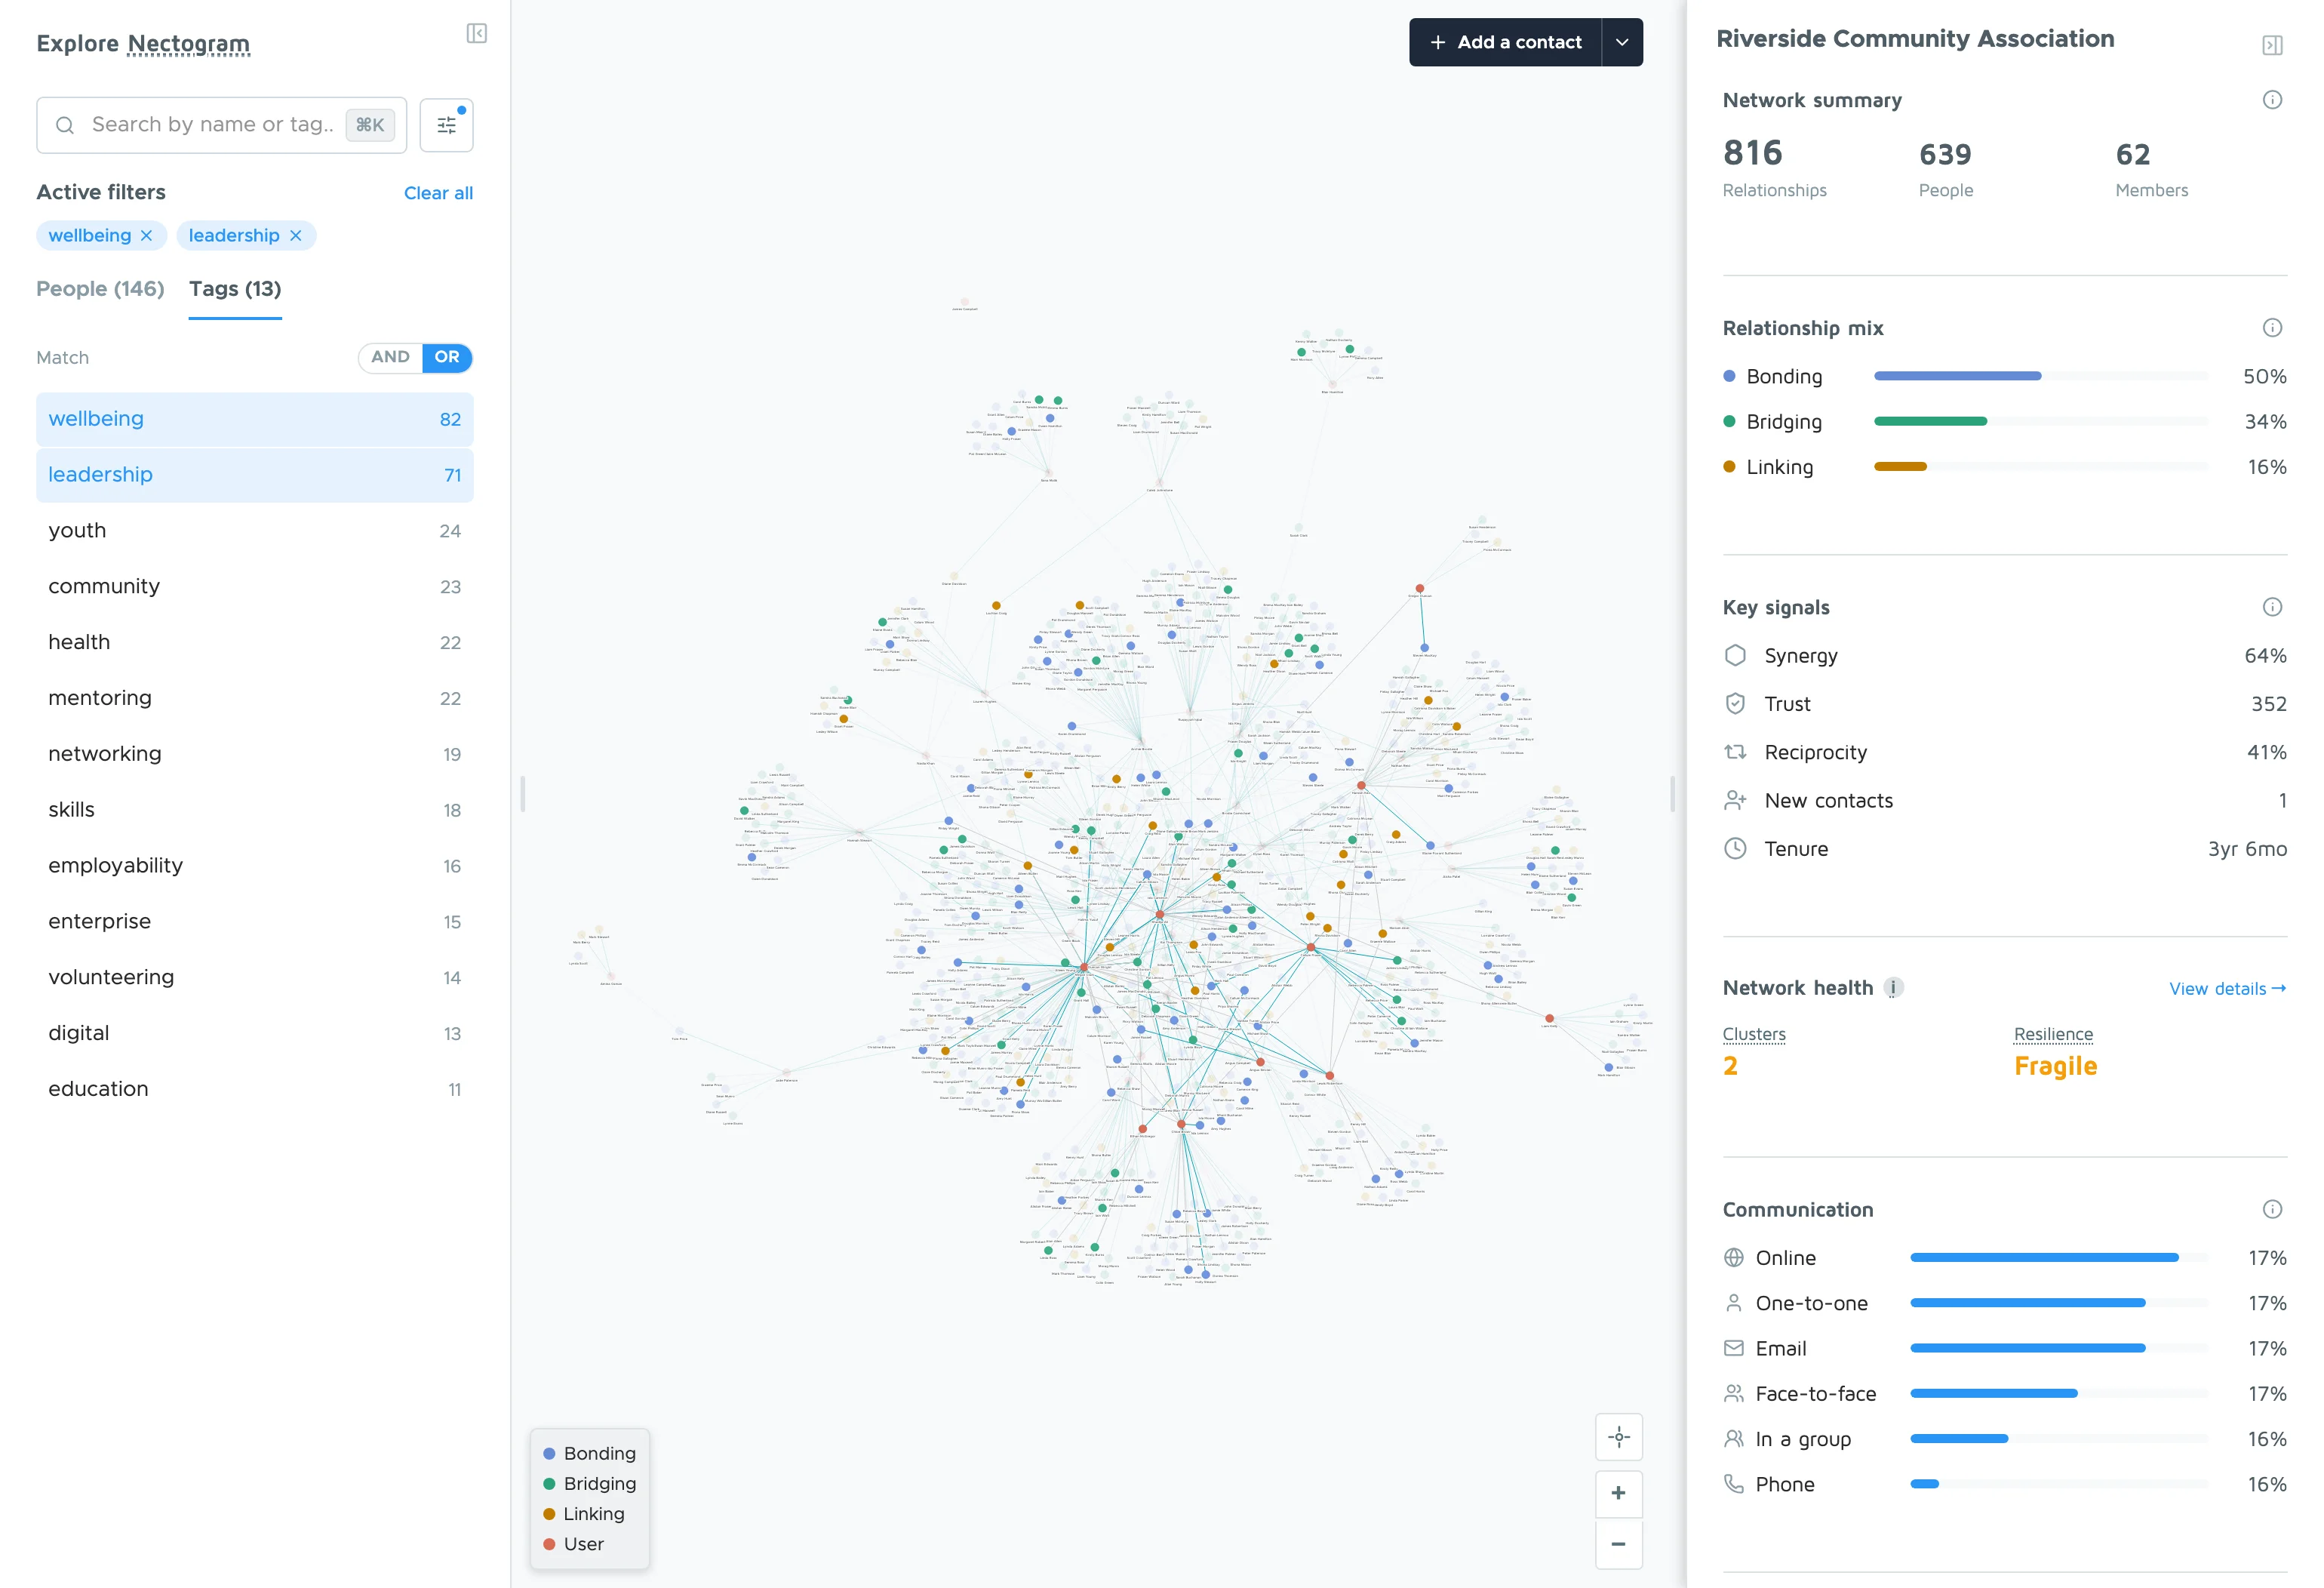
Find people by what they do, not just who they know.
Tag connections with the skills, interests, and roles that matter to your programme. Then surface everyone with a tag in one click. See how "employability mentors", "youth workers", or "volunteers" cluster in your network.
Different lens, same data, different question answered.
Real-time
No waiting. No batch processing. No stale data.
When connections are added or imported, your Nectogram updates live. Watch your network take shape in real time. Every view is current, always.
Scale
From a 10-person team to a national programme.
Individual
Map your network. Complete assessments. Track your growth over time.
Manager
Manage projects, view team data, invite members, generate reports.
Portfolio
Oversee multiple organisations. View aggregate data. Track programme-wide outcomes.
Role-based access keeps everyone focused on what matters to them.
See it in action with your own data.
30-minute walkthrough. We'll map a real network, run a compass assessment, and show you what a report looks like.
Book a demo