Colin Campbell has spent over 20 years working alongside housing associations, disability organisations, and government programmes to measure what community development actually changes.
Key takeaways:
- A network map shows every person in your programme as a dot and every relationship as a line between them. You can literally see who is connected, who is isolated, and what changed over time. It is the clearest way to show funders what your programme actually did.
- The before-and-after comparison is what makes this powerful. Map your community at the start. Run your programme. Map it again. The difference is visible, measurable, and hard for anyone to argue with.
- Without this, you cannot answer the funder’s question. Attendance sheets tell you who showed up. They do not tell you what changed. When the board asks whether the programme is worth continuing, you need data that shows the community is structurally different from when you started.
- You do not need to be a researcher. This guide walks through how the whole process works, from your first baseline in the app to the report that goes to your funder.
A breakfast club, a before-and-after, and three years of funding
Heart & Sound ran a breakfast club in Fife for young men aged 16 to 24. The lads were isolated, many dealing with depression and low self-esteem. The programme gave them somewhere to go, people to talk to, and a reason to get out of bed.
The team knew the programme was working. They could see it in the room. But when they needed to renew their funding, “you can see it in the room” was not going to cut it.
So they mapped the relationships. At the start of the programme, there were 41 connections between participants, with 28 of those involving trust. Six months later, they mapped the same group again. Now there were 161 connections (a 293% increase) and 111 trusting relationships (a 296% increase). Every type of connection, close ties, cross-group relationships, links to people in positions of influence, had grown.
293% increase in connections at Heart & Sound, turning attendance data into three years of follow-on funding
They put those numbers in their funding bid. They secured three years of follow-on funding from the Improving Lives programme. Without the maps, they would have had attendance sheets and a handful of testimonials. With them, they had proof.
That is what mapping your community’s connections can do. Not prove that your programme is nice. Prove that it works.
What you actually see on screen
A platform called Nectis generates these maps. Here is what it actually looks like.
Imagine opening your laptop and seeing every person in your programme as a dot on the screen, with lines connecting people who know each other.
Blue dots represent close, personal ties: the people who trust each other, who would lend each other money or watch each other’s kids. Green dots show connections across groups: the person from the community garden who now knows someone from the tenants’ forum. Gold dots show links to people in positions of influence: a housing officer, a local councillor, a GP. Lines between the dots show who is connected to whom.
The dots cluster together where communities are strong. At the edges, you spot isolated individuals, the people your programme has not yet reached. The colour balance tells a story at a glance. If the map is almost entirely blue, people are connecting within their own circle but not reaching outward. If green and gold dots are appearing, your programme is building the kinds of connections that make communities resilient.
Three colours, one story. Blue for close ties, green for cross-group connections, gold for links to decision-makers. The balance tells you what your programme is building.
Now imagine two of these maps side by side. One from the start of your programme. One from six months later. Here is the real example from Heart & Sound:
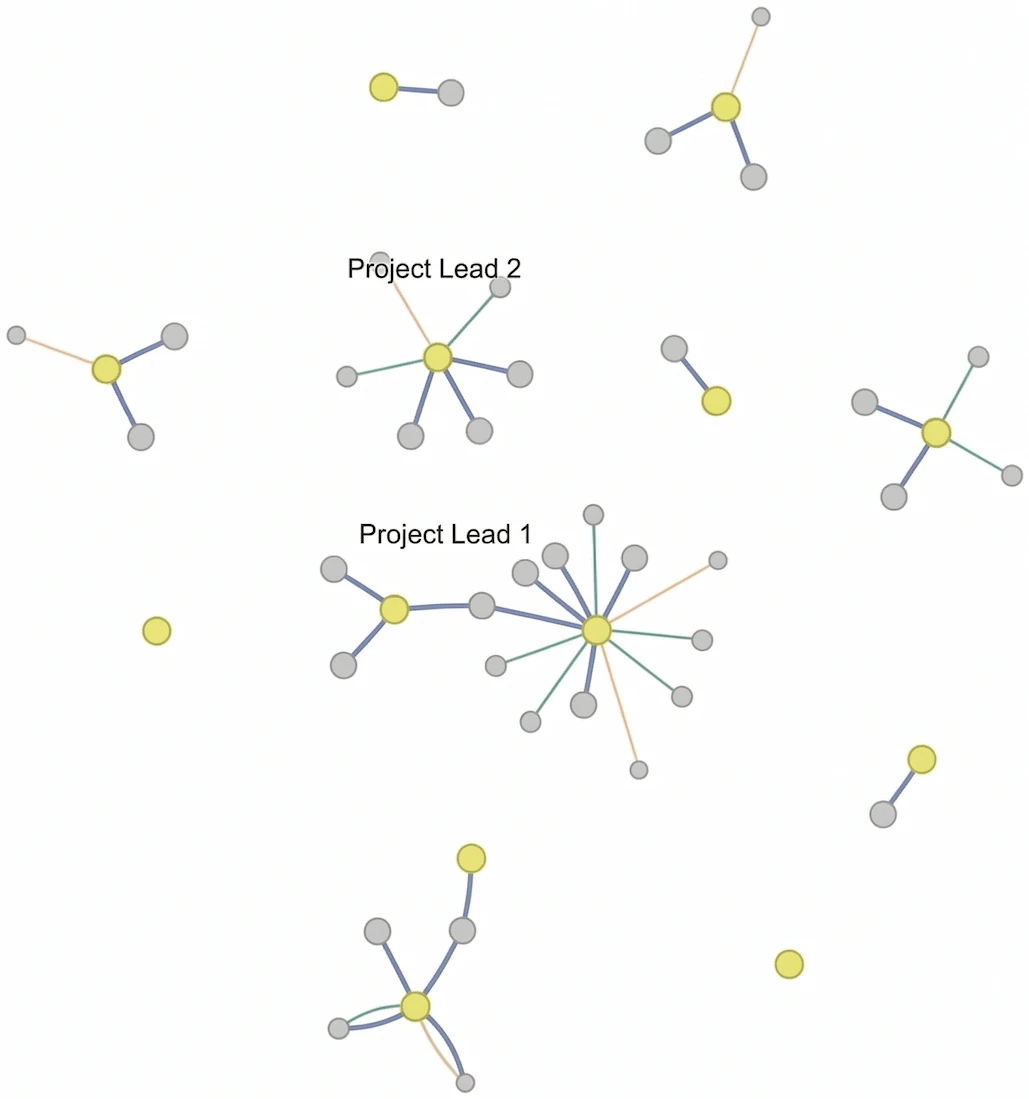
25 bonding · 10 bridging · 6 linking · 28 trusting
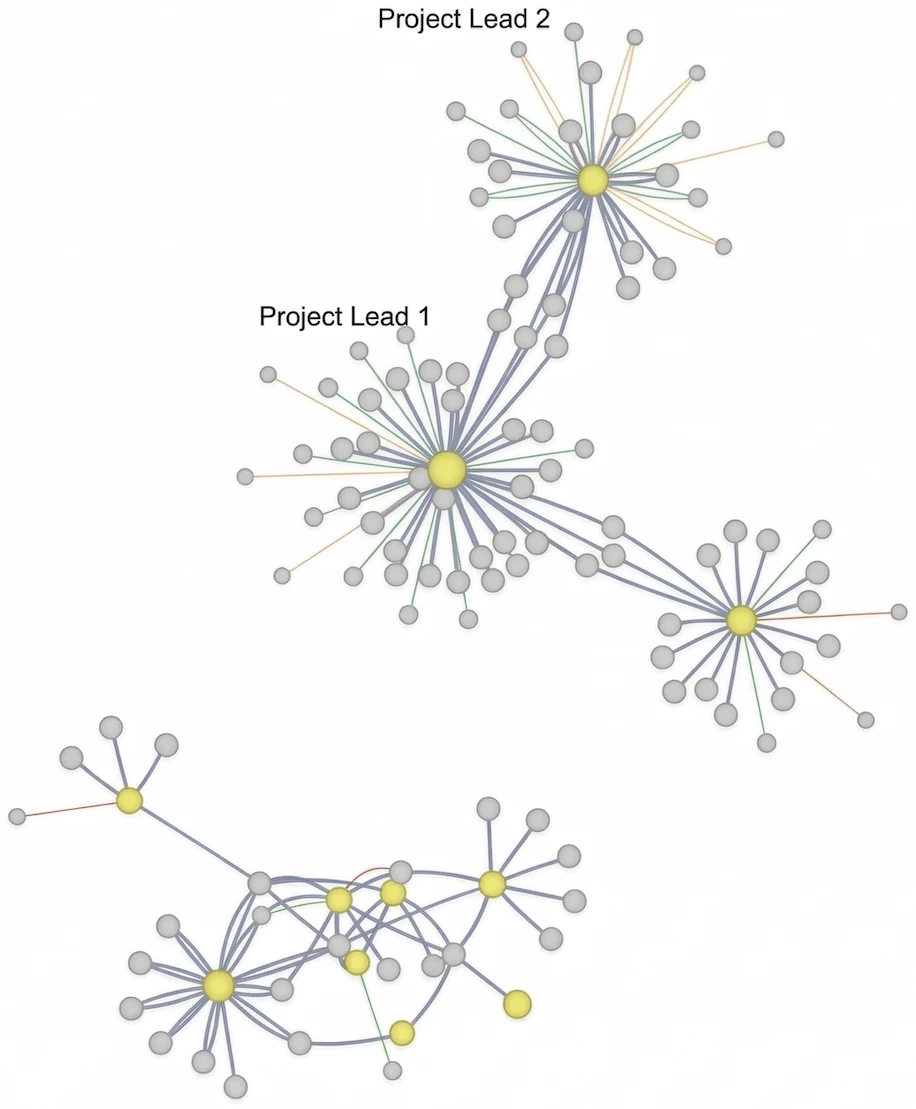
122 bonding · 23 bridging · 16 linking · 111 trusting
On the left, a sparse picture. Scattered dots. A few small clusters. On the right, the same community, but transformed. Dense webs of connections. People who were isolated at the edge are now embedded in the network.
That visual comparison is what we call a Nectogram. And that is the picture you put in front of your funder.
What happens when you don’t have this
Without before-and-after connection data, you are left explaining your programme’s impact in terms that do not land.
You can say “we ran 12 events and 180 people attended.” The funder nods politely and asks: “But what changed?” You can say “participants told us they feel more connected.” The board member asks: “More connected than what? Compared to when?” You can point to testimonials. The finance director asks: “Is this programme worth continuing at this cost?”
And you cannot answer any of those questions with confidence. Not because the programme is not working. Because you do not have the data to show that it is.
You cannot answer any of those questions with confidence. Not because the programme is not working. Because you do not have the data to show that it is.
This is not a hypothetical problem. Community development is the first budget line to get cut. The teams that survive are the ones who can show, with numbers, what their programmes changed. The teams that rely on attendance sheets and thank-you cards are the ones that lose their funding, their headcount, and eventually their programmes.
Heart & Sound could have been one of those teams. Instead, they had maps and numbers that showed exactly what changed, for whom, and by how much. That is the difference between losing a programme and securing three more years of it.
The numbers behind the picture
The map is compelling on its own, but it comes with hard data. Every connection is counted, categorised, and compared.
Heart & Sound’s story is one programme. Here is another real example: “Take My Hand”, a loneliness programme. Connections grew from 20 to 212, a 960% increase. Explore the before and after with real production data:
The Eden Project’s community network across the UK recorded a 487% increase in total connections. But the critical finding was not the headline number. It was that the type of connection predicted whether someone stayed engaged. More on that in the case studies below.
These are not vanity metrics. They answer the questions funders actually ask: what changed? For whom? By how much? And can you show us?
Why face-to-face events matter more than you think
One of the most practical findings from this work comes from the Eden Project’s community programme. Their data revealed something that should change how you plan your activities.
Face-to-face events create cross-group connections. When people meet in person, across different groups and backgrounds, they form bridging connections that did not exist before. Online platforms, by contrast, maintain existing trust and reciprocity but do not create new connections. People stay in touch with the people they already know. They do not form new relationships through a screen.
The implication is direct. If your programme has shifted heavily toward online delivery (and many have since the pandemic), you are likely maintaining your existing network but not growing it. Online sessions keep connections warm. They do not build new ones.
Check your calendar: If your upcoming activities are mostly online, you are maintaining your existing network but not growing it. Face-to-face is where new bridging connections form. Online sustains what already exists. You need both.
Why this is different from a survey
Most programmes evaluate their impact through surveys, questionnaires, or attendance counts. Those tools have their place. But they measure something fundamentally different.
A satisfaction survey tells you that 85% of attendees rated an event as “good” or “excellent.” That is useful for quality assurance. It tells you nothing about whether those attendees formed any new relationships, whether isolated individuals became more connected, or whether your programme changed the structure of the community.
Here is how the two approaches compare:
| Network mapping | Surveys and questionnaires | |
|---|---|---|
| What it measures | Actual connections between people, their type and quality | Self-reported attitudes, satisfaction, sentiment |
| What it shows | Who is connected to whom, isolated individuals, network structure | How people feel about a programme or service |
| Before/after comparison | Maps connections at start and end, shows exactly what changed | Compares responses over time, but cannot show structural change |
| Evidence strength | Shows what happened (structural change in relationships) | Shows what people think happened (perception) |
| Data richness | Connection types (bonding, bridging, linking), trust, reciprocity | Whatever questions you design |
| Resource required | Participants map their own connections in the app (10 to 20 min each) | Form design, distribution, collection |
| Best for | Proving programme impact, securing funding, identifying gaps | Understanding satisfaction, gathering opinions |
The key distinction: a survey asks someone “do you feel more connected?” A network map shows that they went from 3 connections to 17, that 8 of those are with people outside their immediate circle, and that 5 involve mutual trust. One is an opinion. The other is a fact.
That said, the two methods work well together. The map shows what changed in the network. Surveys and qualitative conversations capture the human stories behind the numbers. The combination is more powerful than either alone.
Four programmes, four sets of evidence
The before-and-after approach has a track record across very different communities. Here are four examples.
Govanhill Housing Association
Govanhill, in Glasgow’s Southside, is one of Scotland’s most diverse neighbourhoods. Govanhill Housing Association ran a 12-month Community Connections project, mapping and growing the community network across cultural, linguistic, and generational lines.
The results:
- 3,316 connections mapped through 55 meetings and events
- 120 volunteer hours contributed by community members
- 2 new Registered Tenants’ Organisations established
- New social enterprises launched
- £24,000 in funding generated for new community enterprises (a £17,000 EU grant, £2,000 from Firstport, and a £5,000 community business fund)
The network maps did not just show that connections existed. They showed what kind they were and how they crossed the divides that characterise the area. That specificity is what made the evidence compelling enough to secure further investment.
Glasgow Disability Alliance
GDA used network mapping to measure the impact of their programmes on disabled people’s relationships.
The findings were stark:
- Before GDA involvement, the average disabled member had 1 connection
- After involvement, the average member had 158 connections
- 69% were bridging connections, meaning members were reaching beyond their immediate peer group
- Members had an average of 11 close connections, 6 reciprocal, and 6 trusting
No satisfaction survey could have told that story. GDA was not just providing services. Their programmes were fundamentally transforming the social networks of disabled people in Glasgow. That evidence was instrumental in demonstrating value to funders.
Eden Project Communities
The Eden Project’s community programme recorded a 487% increase in total connections, a 648% increase in reciprocal connections, and a 545% increase in trusting connections across their network.
They also discovered that active members had mostly bridging connections (cross-group relationships), while inactive members had only bonding connections (relationships within their own circle). The implication was clear. Helping people form connections outside their immediate group is what sustains engagement.
That is the kind of finding that does not just justify a programme. It reshapes how you design the next one.
New Gorbals Housing Association
The longest continuous deployment on the platform. NGHA mapped 678 connections across 21 projects over 8 years, tracking how a neighbourhood’s networks evolved through regeneration, a pandemic, and demographic change. Their data is 46% bridging connections, unusually high, reflecting programmes deliberately designed to connect people across ethnic, cultural, and generational boundaries. This is what longitudinal evidence looks like.
How the whole process works
This is not an academic exercise. It is a structured, practical process that community development teams across the UK run as part of their normal evaluation work. In practice, it is simply mapping your community’s connections at two points in time and comparing them. (The formal term is social network analysis, but you do not need to know or use it.) Here is how it goes.
1. Pick a programme and plan your timing
Choose the programme or project you want to evaluate. Identify your participant group. Plan to capture your baseline within the first few weeks, before your activities start to change the network. Your follow-up will happen at a natural endpoint, often 6 to 12 months later.
A group of 15 to 40 participants is a good starting point. Smaller groups work too, and sometimes produce the most compelling individual stories.
2. Participants map their baseline connections
Each participant logs into Nectis and maps the people they are connected to. For each connection, the app walks them through a few questions: how they know the person, what kind of relationship it is, and whether they trust each other. It takes 10 to 20 minutes and they can do it in their own time. A group of 30 can complete their baselines in parallel over a few days. Existing contact data can be imported via CSV to speed things up.
3. Generate your baseline map
Nectis generates your baseline Nectogram automatically: the visual map showing the starting state of the network. The headline numbers are calculated for you: total connections, breakdown by type, trust count. This is your “before.”
In practice: Steps 1-3 typically take a few days. The longest part is waiting for participants to complete their maps, not the mapping itself. Once you have the baseline, the platform does the rest.
4. Run your programme
Deliver your events, workshops, groups, activities. This is the work you are evaluating.
5. Participants map their connections again
At your chosen endpoint, participants log back in and update their connections. Some attrition is normal and does not invalidate the comparison.
6. Generate the comparison
Nectis generates the updated network map and places it alongside the baseline. The visual difference is often striking. The platform calculates the percentage changes across total connections, type breakdown, trust, and reciprocity automatically.
7. Read the evidence
Look for the patterns that tell your programme’s story:
- Overall growth: Did total connections increase? By how much?
- Type balance: Did cross-group and linking connections grow, or just close ties? A healthy programme builds all three types.
- Trust growth: Did trusting connections grow faster or slower than connections overall? (At Heart & Sound, trust grew at the same rate as total connections. In other programmes, trust outpaced everything else.)
- Individual stories: Which participants saw the biggest changes? Are there still isolated individuals you need to reach?
- Programme insights: What activities correlated with the strongest connection growth?
8. Put the evidence to work
Your network data supports:
- Funding applications and renewals, with specific before-and-after numbers that show exactly what changed
- Regulatory reporting, particularly around community outcomes, tenant engagement, and the “S” in ESG
- Programme design, by showing which activities build which types of connections
- Board reports, with visual maps that make the abstract tangible for directors who have seven minutes to review your paper
Frequently asked questions
How is this different from social media analytics?
Completely different. Social media analytics track online interactions: likes, follows, comments. Network mapping captures real-world relationships between real people, categorised by type and quality. It measures who actually knows and trusts whom, not who clicked a button.
Do participants mind naming their connections?
Rarely. In practice, people are willing and often enthusiastic about mapping their relationships, particularly when they understand the purpose. People want to reflect on how they met someone and what the relationship has meant to them. Confidentiality assurances and clear consent processes are essential, but resistance is uncommon.
Can this work for small programmes?
Absolutely. Groups as small as 10 to 15 people work well. In fact, smaller groups often produce the most compelling before-and-after stories because individual-level changes are clearly visible. Heart & Sound had a small participant group and produced some of the most dramatic results we have seen.
How long does the whole process take?
Participants fill in their connections themselves through the app, in their own time. A group of 30 people can complete their baseline maps in parallel over a few days. You can also import existing contact data via CSV to speed things up. Generating the maps and comparisons in Nectis is instant.
What if we are already mid-programme?
You can still create a baseline retrospectively. People remember who they knew before the programme started. Map those existing relationships now, then map again at the end. The comparison still gives you meaningful before-and-after evidence.
Do we need technical skills?
No. Participants map their own connections directly in Nectis, and the platform handles the analysis and comparison. Your role is to invite participants, explain the purpose, and read the results. If you can send an email and interpret a chart, you can run this.
What to do next
If you are thinking about trying this for one of your programmes, here is where to start:
- Pick one programme. Choose a current or upcoming project where you want to understand what is changing in people’s relationships. Ideally, one where you are about to start or are in the early weeks.
- Map the baseline early. The most common mistake is starting activities before capturing the starting picture. Get participants into the app and mapping their connections within the first few weeks. They can also create retrospective baselines if your programme has already started.
- See it in action. If you want to see what the maps look like with real data, or talk through how it would work for your specific programme, get in touch with us. We are happy to walk you through a real example.
Related reading
- Beyond Attendance Sheets: How to Prove Your Community Programme Actually Works - the full evidence framework, with programme-wide data from six organisations
- Community Cohesion Is in Every Strategy Document. Here’s How to Measure It. - from strategy buzzword to measurable outcomes
- About Nectis - how the platform works
- Case Studies - more examples from housing, disability, and community organisations